1. Introduction
Early forecasting and warning about the possibility of severe convective phenomena, such as mesoscale convective system (MCS), mesoscale convective vortex (MCV), rear inflow jet (RIJ), can be supported by mesoscale numerical weather models with kilometer-scale resolution (Baldauf et al. 2011; Seity et al. 2011; Powers et al. 2017). Compared to global models, limited-area models have the advantage of providing more realistic representation of small-scale phenomena. However, in some convective situations they are still subject to imperfections (Bouttier, Marchal 2020; Schumacher, Rasmussen 2020).
Severe thunderstorms accompanied by strong wind gusts, intense precipitation, hail, and even tornadoes occur every summer in central Europe. In Poland, such phenomena are most frequent in July, between 14 and 16 UTC and over the southeastern parts of the country (Poręba et al. 2022). Well-organized storm complexes, which create their own internal circulation and require stronger environmental wind shear, are called mesoscale convective systems (MCS). One of the first attempts to investigate morphological and precipitation archetypes of MCSs over Poland was presented by Surowiecki and Taszarek (2020). They studied which fraction of active MCS are Quasi-Linear Convective Systems (QLCS), and how often in QLCS the bow echo emerges. The conclusion is that bow echoes appear in 72% of QLCS, and QLCS in 17% of MCS. On the other hand, only 3.5% of MCS were associated with MCV. The squall bow (radar signature of bow echo) happens a few times a year in Poland, whereas its more dangerous version, derecho, happens once per year on average (Celiński-Mysław, Matuszko 2014; Celiński-Mysław et al. 2019). In the paper of Gatzen et al. (2020), the average frequency of derechos in Germany was estimated to be about 2 each year. Studies of convective windstorms in Europe, based on climatological data and reports from the European Severe Weather Database (ESWD) indicates that only 10% of convective windstorms were associated with bow echoes (Pacey et al. 2021).
The evolving convective system observed on 11 August 2017 fulfilled criteria for a derecho, with observed maximal wind gusts exceeding 42 m⋅s-1 (150 km⋅h-1; Taszarek et al. 2019) and was accompanied by a Mesoscale Convective Vortex (MCV). In northwestern Poland huge material damages were reported, including almost 80,000 ha of devastated forest and 6 fatalities (Chmielewski et al. 2020).
Detailed analysis of radar data from 11 August 2017 (using composite maximum reflectivity and radial velocities) confirmed the presence of MCV within the mature stage of MCS (Taszarek et al. 2019; Figurski et al. 2021; Łuszczewski, Tuszyńska 2022). The MCV occurs within surface frontal zones with large temperature and moisture gradients across the environmental vertical shear vector (Davis, Trier 2007). Raymond and Jiang (Walter 2016) idealized MCVs as balanced mid-tropospheric potential vorticity anomalies and postulated that the lifting associated with potential vorticity anomalies in vertical shear may explain some cases of MCS longevity. Placement and evolution of the MCV is presented on relative vorticity maps (Fig. 8).
Fig. 1.
The ALARO NH forecast for r00 run at 15 UTC on 11 August 2017. On the left panel, the temperature at the 850 hPa pressure level; on the right panel, jet stream and pressure at the height of 11 km (ICAO tropopause).
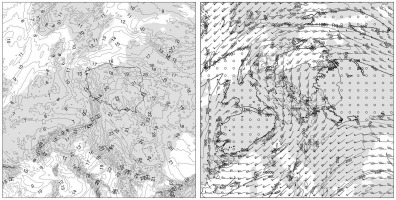
Fig. 2.
The synoptic situation on 11 August 2017, 12 UTC. Credit: IMWM-NRI, Central Office for Meteorological Forecasts, Krakow.
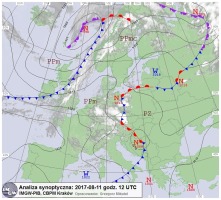
Fig. 3.
Synoptic stations on which wind gusts exceeded 10 m⋅s-1 on 11 of August 2017. Colors refer to the following time spans: 15:00-18:00 UTC (black), 18:00-21:00 UTC (red) and 21:00-24:00 UTC (blue). Stations marked with stars are later used for quantitative evaluation of forecasted wind gusts.
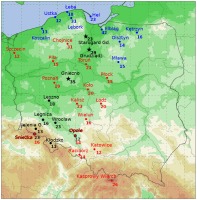
Fig. 4.
Cold pool from ALARO: a) temperature at 2 m AGL; b) atmospheric pressure and surface wind. The forecast for 21 UTC 11 August 2017, r00.
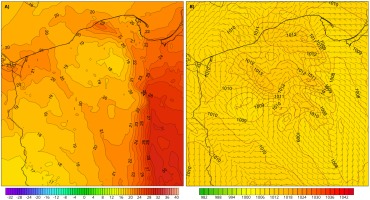
Fig. 5.
The forecast of vertical velocities [m⋅s-1] at 925 hPa level for various runs (r00, r06 and r12) of ALARO on 11 August 2017.
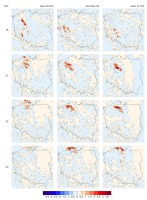
Fig. 6.
MU CAPE [J⋅kg-1], 0-3 km wind shear [m⋅s-1] and pressure [hPa] + wind [m⋅s-1] for NH version of ALARO, the forecast of 11 August 2017, r00.
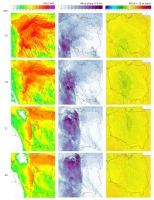
Fig. 7.
Forecasts of wind gusts of ALARO cy43t2 NH model from 11 August 2017, for various base runs (r00, r06 and r12). The first column is radar reflectivity, CMAX, observed for 8 radar stations.
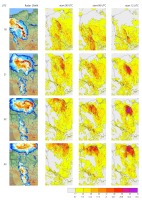
Fig. 8.
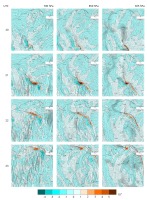
The forecast of MCV and RIJ. Wind (m⋅s-1, vectors) and relative vorticity (s-1, color) at the levels of 700, 850, and 925 hPa between 20 and 23 UTC. ALARO r12 on 11 August 2017.
Typical for MCS is also a presence of a cold pool which emerges under strong convection zone and closely behind it, in an area of higher pressure (Fujita 1960). The cold pool is an area of cold air near the ground created by a downdraft and a loss of heat due to evaporation of rain (Charba 1974). It contributes to creation of new convective cells and supports a squall line (Goff 1976; Droegemeier, Wilhelmson 1985). At the back of the MCS, a current called Rear Inflow Jet (RIJ) can emerge, blowing perpendicularly to a squall line, in agreement with the direction of MCS movement (Houze 2004). It helps to deliver cool and dry air from middle layers of the troposphere (around 500-700 hPa) to the ground (Glickman 2000).
During the past few decades numerous developments in physical parameterizations and data assimilations have been applied to more precise model predictions of mesoscale convective windstorms (e.g. Brousseau et al. 2016; Tao et al. 2016; Wimmer et al. 2021). In a crucial study, Weisman et al. (2013) described a derecho in the United States using the Advanced Research core of the Weather Research and Forecasting model (WRF-ARW)) with spatial resolution of 3 km × 3 km and the explicit convection-permitting algorithm. Dixon (2016) tested capabilities of data assimilation for improving model forecasts at horizontal grid sizes of 10 km × 10 km and 4 km × 4 km when predicting the derecho situation of 29 June 2012 in Utah. Because the event of 11 August 2017 in Poland caused huge material damage, it has been the subject of studies by many research groups. Taszarek et al. (2019) is one of the most significant review papers related to the 11 August 2017 derecho, in which the NWP, synoptic, and radar contexts are thoroughly described. Tropospheric parameters during that day were also analyzed with global navigation satellite systems (GNSS) to estimate precipitable water vapor (PWV) (Nykiel et al. 2019). The study has proven it possible to monitor the derecho event with GNSS. Another study (Figurski et al. 2021) aimed to assess the impact of initial and boundary conditions on severe weather simulations using a high-resolution WRF model with four global model predictions. The study indicated that the best forecast was obtained using initial/boundary conditions from the National Centers for Environmental Prediction (NCEP) Global Data Assimilation System (GDAS) and Global Forecasting System (GFS) models at 12 UTC, while using the ERA5 (Hersbach et al. 2020) data gave the predictions least consistent with the observations of the maximum reflectivity fields (Figurski et al. 2021).
The research reported here was undertaken to assess quantitatively different configurations of ALARO and AROME models for the derecho of 11 August 2017. We have verified how different initial and boundary conditions affect the quality of simulations by using two non-hydrostatic models, ALARO and AROME. Studies were also designed to estimate which meteorological fields (e.g., wind gusts, CAPE, 0-3 km wind shear) would be appropriate for prediction of such phenomena.
All the analyses of the forecasts of severe weather phenomena (related to wind gusts) by ALARO and AROME refer to the forecasts for 11 August 2017. Both models were computed for 3 sets of different initial conditions: 00 UTC (from now on, r00 run), 06 UTC (r06 run) and 12 UTC (r12). In Section 2, the synoptic context of the 11 August 2017 derecho is described; data and methods are presented in Section 3. The results (mainly forecast maps and their description) can be found in Section 4. Section 5 is their discussion and Chapter 6 presents general conclusions. The last Section 7 contains summary and outlook.
2. Synoptic situation
The synoptic situation which led to the storm on 11 August 2017 is described in the paper of Wrona et al. 2022 (see also Figurski et al. 2021). From 9 August 2017, warm and moist tropical air was advected over central and eastern Poland and persisted for several days. In the meantime, cold, polar-maritime air lingered above Germany. At the level of 850 hPa the temperature difference between the air masses reached 10 C. The temperature gradient was visible also on the prognostic maps of the ALARO model (Fig. 1). This gradient was gradually increasing due to frontogenesis over the western border of Poland.
Developing storms in a warm air mass before a waving front (Fig. 2) transformed from single cells and disorganized multi-cell systems into supercells and coalesced into the large MCS (Taszarek et al. 2019; Łuszczewski, Tuszyńska 2022). Then a quasi-linear-convective-system (QLCS) developed and finally turned into a strong bow echo and MCV. The radar signature of the bow echo indicates the possibility of strong wind gusts in that area. We checked that it corresponds with the maps of CMAX simulated by NWP models (Fig. 7). Additionally, on the basis of vertical wind profiles from Prag, Prostejov, and Wroclaw we reasoned the existence of a strong jet stream.
The velocities of wind gusts that exceeded 10 m⋅s-1 on 11 of August 2017, as well as station names, are plotted on Figure 3. (The forecasted velocities are plotted on the map in Figure 4b.) Colors refer to the following time spans: 15:00-18:00 UTC (black), 18:00-21:00 UTC (red) and 21:00-24:00 UTC (blue), while velocities are expressed in m⋅s-1. Stations marked with stars are later used for quantitative evaluation of forecasted wind gusts.
The wind gusts approached from the southwest. Initially, high values were recorded before 15 UTC on synoptic stations at Śnieżka and Kasprowy Wierch (not marked on the map). Then the zone of extreme wind values moved to central Poland and then northwards. The top wind gust speed, 42 m⋅s-1,was recorded in Elbląg.
3. Data and methods
In the Center for Meteorological Modelling of the Institute of Meteorology and Water Management – National Research Institute (IMGW-PIB), two models of Aire Limitée Adaptation Dynamique Development International (ALADIN) have been used operationally for nearly 3 years for numerical weather prediction (NWP): Application of Research to Operation at Mesoscale (AROME) and ALARO (ALADINAROME) in version cy43t2. Both ALARO and AROME are the part of the Aladin System developed by the international consortium ACCORD (ALADIN until November 2020) and successors of the former ALADIN model (also used by the ALADIN Poland team). Both models in their earlier versions were used previously for prediction of severe storms (Seity et al. 2011; De Meutter et al. 2015).
The ALARO is non-hydrostatic (contrary to its predecessor, ALADIN), includes vertical accelerations in the equations of motion and has a shorter time step than ALADIN. The current version of the model uses a 4 km × 4 km horizontal grid, 60 hybrid vertical sigma-levels (following the orography) and has a forecast range of 72 h. Horizontally, the computing grid had 789 × 789 points and the domain was 3156 km × 3156 km. The initial and boundary conditions come from the global model ARPEGE in its cy42 version. The dynamical core of ALARO is based on fully compressible Euler equations. The surface processes’ parameterization is based on the Interaction Soil-Biosphere-Atmosphere (ISBA) module. The microphysics scheme covers 6 types of hydrometeors: dry air, water vapor, suspended water, cloud ice crystals, rain, and snow (Lopez 2002). Shallow convection is computed according to the TOUCANS scheme, and deep convection by Modular and Mesoscale Microphysics and Transport (3MT, described by Gerard et al. 2009). For parameterization of clouds, the Cloud System Resolving Model (CSRM) and deep convection model were used (Termonia et al. 2018).
The AROME model was implemented with a horizontal grid size of 2 km × 2 km and 60 hybrid vertical levels (following the orography); it is non-hydrostatic and assumed to represent convection explicitly. It employs 799×799 grid points and the domain size is 1630 km × 1630 km. The forecast range equals 30 hours and one time step of integration is less than 1 minute. The initial and boundary conditions are taken from ALARO, which means that AROME is integrated after the end of ALARO forecast computation. Coupling of AROME version cy43t2 with ALARO occurs once every hour. The shallow convection scheme is described by Pergaud at al. (2009). Microphysics is parameterized by the three-phase ICE3 scheme, and the surface by the SURFEX module (Masson et al. 2013). The parameterization of clouds is done statistically, and there is no parameterization of deep convection (Seity et al. 2013). Both of these configurations were used in this study but were not available in 2017.
The fields used for the analysis of the situation include mesoscale drivers of convective system (such as Convective Available Potential Energy; CAPE, and vertical wind shear), deep convection related parameters (e.g., vertical velocities and cold pools), as well as wind gusts, relative vorticity, reflectivity CMAX, wind, and 2 m temperature. CAPE as used in this study is the Most Unstable Convective Available Potential Energy (MU-CAPE), which computation starts from the parcel at the most unstable model level defined by the largest theta-e value. Derechos are frequently associated with MU-CAPE values in excess of 3000 J⋅kg-1 in the source region (Evans, Doswell 2001). Coniglio and Stensrud (2001) have shown that mid-level shear (0-3 km) helps to maintain deep convective systems and that shear exceeding 15 m⋅s-1 connected with sufficient instability may lead to very severe storms with damaging wind gusts (Weisman at el. 2013; Celiński-Mysław et al. 2019).
For quantitative evaluation of forecast wind gusts, data from three automatic weather stations were used: Gniezno, Grudziądz, and Starogard Gdański. These stations were situated on the track of the MCS. Since model data were available hourly and data from stations were recorded every 10 minutes, for comparison we use maximum wind gust values from every hour. We also computed root mean square errors (RMSE) and bias for ALARO and AROME models for all synoptic stations in Poland (Table 1).
4. Results
4.1. ALARO forecast of convective phenomena
The possibility of large MCS with strong updrafts together with extreme wind gusts (using ALARO forecast on 11 August 2017, at 18, 21, 22 and 23 UTC the same day and r00, r06 and r12 model runs) was analyzed.
Analysis of vertical velocity maps from ALARO (Fig. 5) prove that the convective phenomena were far more extended for r06 and r12 runs. Vertical velocities of convective upward motions cover a wider area, and the maps show that strong, dominating upward motions (red) neighbor on downward motions (blue) in many places. These dynamics reflect a highly unstable atmosphere, with convective potential energy strengthened by a warm tropical air mass which occupied eastern Poland. Strong upward motions were visible up to the 300 hPa pressure level and persisted through the whole duration of MCS over Poland. The greatest forecasted velocities of upward motions were for r12 run: 4.1 m⋅s-1 (21 UTC), 3.8 m⋅s-1 (22 UTC) and 3.2 m⋅s-1 (23 UTC). The highest predicted downward motion was equal to –1.0 m⋅s-1 at 21 UTC, also for r12 run.
The three columns of Figure 6 are maps of MU CAPE (left), 0-3 wind shear (middle) and MSLP + 10 m wind (right) for ALARO r00 run; rows represent hours: 15 UTC (top), 18 and 21 UTC (middle), and 22 UTC (bottom). We note that the MU CAPE values at an early hour (15 UTC) are higher than at 21 and 22 UTC, the physical consequence of passage of the MCS. The values of wind shear remain high for all hours, but the position changes towards the northeast later (21-22 UTC). MSLP and 10m wind from 18 UTC to 22 UTC change in a very dynamic way as they reflect the cold pool evolution (Fig. 7). In Figure 7, the observed radar column maximum reflectivity, CMAX, is compared with the forecasted position of wind gusts of different model runs. All the model forecasts produce close positions of the severe weather phenomena.
The ALARO r00 forecast underestimates the strength of wind gusts but reflects well the position of the moving MCS (Fig. 7). The ALARO r06 and r12 forecasts are late in comparison with observations, but still the MCS track is well-predicted. As the MCS moved northwards, the intensity of wind and convection increased, with culmination after 18UTC and persistence until the late evening hours on 11 August 2017. In each of the forecasts (Fig. 7) wind gusts velocity exceed 63 knots (32.4 m⋅s-1), with maximum local values of 55.49 m⋅s-1 (21 UTC), 69.3 m⋅s-1 (22 UTC) and 43.78 m⋅s-1 (23 UTC) for run r12. The shift in time of forecasted track position in comparison with observations may be explained by the fact that for r06 and r12 there was too little time to develop a derecho fully from the forecast initiation. Such an effect (stronger for more complex phenomena) is met in the forecast of cloudiness, deep convection, or storms and is called spin-up. This means that a model needs some time to develop a full range of weather phenomena from initial and boundary conditions. Such time is dependent on the construction of a given NWP model.
During the analyzed period the MCV was accompanying the MCS. The most developed MCV was forecasted by ALARO r12. Figure 8 presents ALARO r12 wind and relative vorticity forecast at 700, 850, and 925hPa pressure levels. The Figure shows the evolution of the mesocyclone (an area with higher vorticity, with colors) movement and intensity between 18 and 23UTC.
In the case of r00, the less consistent structure of the convective system has a form of two smaller vortices, whereas r06 predicts weaker intensity of a single MCV (not shown here). According to ALARO r12, the vorticity of the MCV appears at 925 hPa level and then propagates upwards, reaching 700 hPa level at 20 UTC (Fig. 8). In its culmination (21 UTC) it stretches from 500hPa downwards, reaching top values from 3.7⋅10-3s-1 (500 hPa) to 6.6⋅10-3s-1 (for 925 hPa). At that time, in the high troposphere (at the 300 hPa level), directly above the MCV, there is an increase of the geopotential, and rise of air pressure. After 21 UTC the vortex in the middle troposphere weakens, lasting longest at 850 and 925 hPa levels.
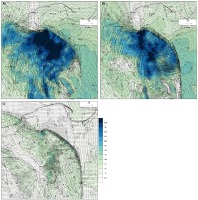
Other phenomena accompanying MCS are RIJ and cold pool. All three ALARO model runs predict RIJ, but its smallest intensity is predicted by the forecast run from r00. The reason is that the MCS for that run was less compact, with several smaller squall lines. R06 and r12 runs forecasted the consistent structure, at the back of which we found strong current in the direction of MCS motion (Fig. 8 for r12) which can be seen also for 20 UTC at pressure levels 700, 850, and 925 hPa. As it is a gradually descending current, its length was greater at higher levels, and the shortest was near the surface. This structure is well represented in the forecasts for 22 UTC (Fig. 9 for r12).
Fig. 9.
Wind and the module of velocity (color) at pressure levels of 850 (a) and 925 hPa (b); wind and the module of velocity (color) at 10 m AGL (c). ALARO r12 forecast for 22 UTC, 11 August 2017.
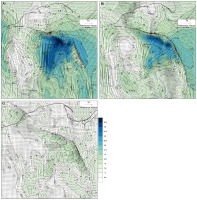
For ALARO, the cold pool forecast is most distinct for the r00 run. We noticed it between 19 and 20 UTC on the map of temperature at 2 m AGL, and we saw it at 21 UTC in the form of closed isotherms of colder air (Fig. 4a). Despite the modest temperature contrast (2-4°C), the cold pool is clearly imposed over the area of higher pressure near the ground (Fig. 4b) closely behind the squall line, in the northwestern direction from the low-pressure region, which overlaps the area of relatively high surface temperatures.
The area of lower temperature was also visible on the maps of temperature at altitudes of 850 and 925 hPa (not presented).
4.2. AROME forecast of convective phenomena
The AROME was created as non-hydrostatic, high-resolution (convective scale) model for prediction of storms and torrential rain. It appeared to precisely describe a wider family of severe weather phenomena including bow echoes, derechos, and tornadoes, as well as strong wind gusts connected to these events (Seity et al. 2011).
The simulated maximum reflectivity CMAX predicted by AROME (and presented in Fig. 10) is higher than measured by radars, suggesting a larger quantity of hydrometeors than in actuality. The bow echo (visible on radar maps) is well reconstructed in the AROME forecasts. Also, the area of lower reflectivity (appearing usually behind a squall bow) is visible, as well as the eddy on the northern west end of the squall bow. For the r12 run, the maps of simulated radar maximum reflectivity were in best agreement with observed maximal reflectivity in terms of position and signal intensity in dBZ. For the r00 run on 11 August 2017, the AROME model forecasted strong wind gusts farther north than the CMAX measurements (reflectivity; Fig. 10). For the evening hours of this forecast run, the model predicted maximum wind gusts over the Baltic Sea, which was not in agreement with CMAX positions measured by the radar. The AROME r12 forecast underestimated wind gusts but reflected well the position of the moving MCS (Fig. 10). The predicted wind gust velocity exceeded 63 knots (32.4 m⋅s-1), with maximum local values of 49 m⋅s-1 (20 UTC), 43 m⋅s-1 (21 UTC), and 47 m⋅s-1 (22 UTC) for r12 (Fig. 10).
Fig. 10.
The CMAX and wind gusts forecasts from AROME cy43t2 on 11 August 2017, for different forecast bases (runs). The first column is CMAX from the radar, based on observations from several radar stations. Color scale is valid for both radar and model CMAX maps.
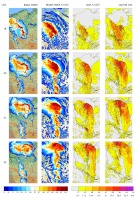
Figures 11 and 12 present the maps of severe weather indices, relative vorticity, and wind for the AROME model.
Fig. 11.
MU CAPE [J⋅kg-1], 0-3km wind shear [m⋅s-1] and 500 hPa vertical velocity [m⋅s-1] for AROME cy43t2 r12 forecast on 11 August 2017.
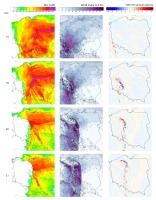
Fig. 12.
MCV forecast. The wind and relative vorticity (color) at the 700, 850 and 925 hPa levels for AROME cy43t2 r12 forecast on 11 August 2017.
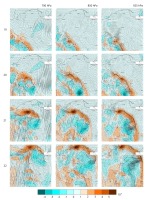
Another severe weather phenomenon forecasted by AROME was a cold pool. Despite a small temperature contrast, it is clearly visible on the maps of 2 m temperature for the 21 UTC r12 run (Fig. 13a) and overlaps the area of increased pressure (Fig. 13b) right behind the squall line. At the levels of 925 and 850 hPa (not shown), one can notice a decrease of air temperature in that area. For the AROME r06 run a cold pool was not easy to notice. In the middle and lower troposphere, at the back of the system, a strong influx of air towards the squall line can be found (Fig. 12 for 700, 850 and 925 hPa, for r12). This RIJ was traced more clearly by the AROME r12 run than at r00 and r06. For r12, RIJ was most visible on the 21 UTC map (Fig. 14) in the area stretching close to the ground from the squall line up to about 100 km southwest from it, parallel to MCS movement. At the levels of 850 and 925 hPa (Fig. 14b), the zone of high wind speeds (exceeding 63.5 m⋅s-1) is more extended than for ALARO (Fig. 9).
Fig. 13.
Cold pool, AROME forecast: (a) 2 m temperature, (b) atmospheric pressure on the ground. The forecast for 21UTC 11 August 2017, r12.
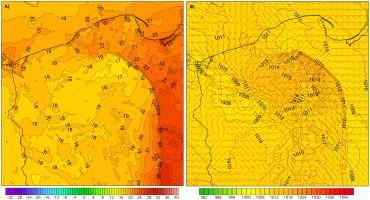
Fig. 14.
Wind and the module of wind speed (color) on the map of 850 and 925hPa pressure levels (a and b); c) wind and the module of the wind speed (color) at 10m AGL AROME forecast for 21UTC, 11 August 2017, r12.
Considering MCV, from 19 UTC at 850 hPa one can see a cyclonic curl of wind, faintly visible also at 700 hPa (Fig. 12 for r12). It is accompanied by a local minimum of relative vorticity. For 20 UTC, the mesocy-clone is visible also at 925 hPa (Fig. 14a). About 21 UTC the relative vorticity reaches its peak of 1.6⋅10-3s-1 (850 hPa) and an expansion of the high vorticity region follows (Fig. 12). After 22 UTC, according to the AROME forecast, the MCS reaches Gdansk Bay and MCV vanishes because the Baltic Sea is colder than Pomerania and the coast.
4.3. Forecast evaluation
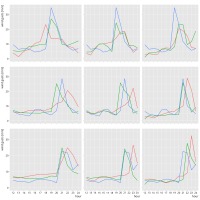
In order to better visualize the capability for forecasting wind gusts by ALARO and AROME models, a quantitative verification is presented in Figure 15. Three stations that recorded high values of wind gusts were selected (stations are ordered from southernmost to northernmost): Gniezno, Grudziądz and Starogard Gdański. For both models and runs from 00, 06 and 12 UTC, wind gust forecasts are presented along with recorded values. All runs and both models are characterized precisely by the timing of the greatest wind gusts. For Gniezno station (Fig. 15 top row), the AROME model (green line) performs better both in terms of timing and magnitude, but the maximum wind gusts are underestimated by almost 10 m⋅s-1. The best forecasts for Grudziadz (Fig. 15 middle row) are obtained from 12 UTC runs (Fig. 15 right column) with almost perfect timing and values for observed peak wind gusts (blue line), especially for AROME forecasts, whereas the ALARO model (red line) predicted the maximum value better, but one hour later than observations. For the Starogard Gdański station (Fig. 15 bottom row) the forecasts from 12 UTC turned out to be the worst for both models, with overestimation of wind gusts and forecasting them one (AROME) or two hours (ALARO) late.
Fig. 15.
Wind gust measurements (blue lines) and forecasts from ALARO (red lines) and AROME (green lines) models starting from 00 UTC (left), 06 UTC (middle) and 12 UTC (right) for stations Gniezno (top row), Grudziądz (middle row) and Starogard Gdański (bottom row) for 11 August 2017 from 12 UTC to 24 UTC.
ALARO and AROME wind gust forecasts starting from 00, 06, and 12 UTC were also compared with measurements from all synoptic stations in Poland. Table 1 presents RMSE and bias scores for both models. The AROME model starting at 00 UTC outperforms other forecasts both in terms of RMSE and bias. The biggest errors were noted for both models for 12 UTC runs.
It is not straightforward to evaluate models based on observational data in the case of such an intensive phenomenon, and using forecasts up to 24 hours instead of reanalysis. Models can predict the behavior of an event accurately, but with a small number of synoptic stations or coarse resolution of gridded data, standard scores can be misleading. Therefore we decided to evaluate the possibility of predicting the intensity of the derecho by analyzing the distribution of wind gusts in Poland (grid points from ALARO and AROME models within the Polish border and over the Baltic Sea up to 55.5 N) from various models and runs. Figure 16 presents the distribution of forecasts of wind gusts from 12 UTC to 24 UTC on 11 August 2017, with the AROME model on the top row and ALARO on the bottom row. Runs for 00 UTC are displayed on the left column, 06 UTC runs on the middle column, and 12 UTC runs on the right column.
Fig. 16.
Distribution of wind gust values in Poland for 11 August 2017 from 12 UTC to 24 UTC. AROME top row, ALARO bottom row, 00 UTC runs left column, 06 UTC runs middle column, 12 UTC runs right column.
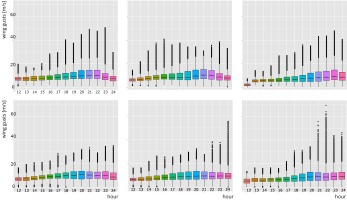
All runs for both models predict very strong wind gusts, but the ALARO model for 12 UTC predicts values exceeding 60 m⋅s-1 at 22 UTC; ALARO from 06 UTC predicts values slightly less than 60 m⋅s-1 at 24 UTC, while AROME runs from 00 and 12 UTC predicted maximum wind gusts close to 50 m⋅s-1.
5. Discussion
Severe weather phenomena such as MCV, RIJ, and a cold pool were optimally mapped by r12 of AROME. For the earlier runs (r00 and r06) the model forecasted the squall line slightly too far northeast (Fig. 10) and strong wind gusts over a wider area than the AROME r12 forecast. Moreover, maximum wind gusts (for the maps of Fig. 10) were shifted northwards, over the Baltic Sea.
For the r00 forecast of ALARO, the location of the leading edge of the strong wind gusts area was shifted by tens of kilometers to the northeast, compared to the position of higher radar reflectivity (Fig. 10). The discrepancy is probably influenced by initial and boundary conditions for earlier runs of ALARO
Mis-positioning of the event for the r00 and r06 runs occurs also in simulations from the WRF model done by Taszarek et al. (2019), however the reported shift was towards the west. Additionally, one of their simulations, which was based on initial conditions from GFS, suffers from an underestimation of wind gusts, which is consistent with our results from ALARO. Similar issues were confirmed for all considered sources of initial conditions for the WRF model by Figurski et al. (2021). Both research teams found the latest forecasts (r12) to be the most precise regarding the position and the strength of the event. Taszarek et al. (2019) suggested that this result might be an effect of a proper simulation of mid-tropospheric cloud cover in a pre-convective environment, contrary to our findings regarding ALARO.
The AROME forecast values of CAPE and 3-0 km wind shear (Fig. 11) were higher compared to those predicted by ALARO (Fig. 6). At 15 UTC the maximum value for MU CAPE from the AROME forecast reached 5956 J⋅kg-1, while for ALARO it was 4669 J⋅kg-1. Until 21 UTC for both models maximum CAPE values were decreasing, but still were over 4000 J⋅kg-1. Wind shear in the 0-3 km layer from 15 to 21 UTC has constantly high values (>35 m⋅s-1 for ALARO and >45 m⋅s-1 for AROME). The models predicted the greatest wind shear at 20 UTC: ALARO 40.8 m⋅s-1 and AROME 48.3 m⋅s-1. The values of vertical velocity at 500 hPa (Fig. 11, right column) were significantly higher for the model using full deep convection equations, reaching 20 m⋅s-1 (18 and 20UTC) and 26 m⋅s-1 (19 UTC). For AROME, the strongest convection regions at 925 hPa were very narrow and overlapped the convergence lines of wind (not shown).
The evolution of the MCV is not predicted identically by both models.
6. Conclusions
Both ALARO and AROME models forecasted a mesoscale convective system (MCS), a bow echo structure as well as MCV – a mesoscale convective vortex. The fields, such as: pressure and wind, geopotential and wind, temperature, as well as vertical velocity maps, CAPE and wind shear were valuable for the analysis of the atmospheric state. The maps of simulated reflectivity (CMAX from ALARO, Fig. 7) visualize the path of the phenomenon for evening hours on 11 August 2017, thus both the evolution of a structure and a position of MCS. AROME model forecast from 12 UTC predicted properly MCV, however the prediction of position of convective phenomena like MCV (for AROME r00 and r06) was more misleading than for ALARO.
One should be aware of necessity for forecasters to use better resolution maps which can be obtained by downscaling the most complex areas. That seems to be the future but would be crucial in the process of immediate diagnosis of the meteorological situation by the team of forecasters.
7. Summary and outlook
On 11 August 2017, the system of strong winds caused serious damage and fatalities while passing through north-western Poland. The post-factum weather forecast by the means of the presently available model, a non-hydrostatic one with 4 km × 4 km horizontal resolution (unavailable in 2017), predicted wind gusts of velocity exceeding 150 km⋅h-1. In the past, there were several papers confirming that enhancing accuracy of forecast can be obtained by better model resolution (Bryan et al. 2003; Lean et al. 2008; Brousseau et al. 2016; Squitieri, Gallus 2020). It would be valuable to explore the weather system by AROME model with different initial and boundary conditions or run models with higher horizontal and vertical resolution. Such models could be a test version of AROME with horizontal resolution 1 km × 1 km and over 100 vertical levels, or ALARO with horizontal resolution of 2 km × 2 km. Operational run of higher resolution models may help forecasters to predict future severe convective events more efficiently.


