1. Introduction
Thunderstorms in Poland mainly occur in the warmer part of the year. Each year, there are about 150 days with thunderstorms in Poland; their frequency increases from the north to the southeast (Taszarek et al. 2015; Sulik, Kejna 2023). The smallest number of thunderstorm days (TD) per year has been recorded in the region nearest to the Baltic Sea (10-15 TD), while the highest activity occurs in the southeastern part of the country (35-40 TD). Thunderstorm activity in the warmer part of the year increases markedly from May to the end of August (Fig. 1B). Thunderstorms also occur in the cooler part of each year, but their number and electrical activity are nearly negligible.
Fig. 1.
A. Number of thunderstorm days in Poland by seasons derived from the PERUN lightning detection system; B. Number of cloud-to-ground flashes in Poland by seasons derived from the PERUN lightning detection system; C. Number of damaging lightning reports in Poland derived from the ESWD database; D. Number of damaging lightning reports in Poland by seasons derived from the ESWD database.
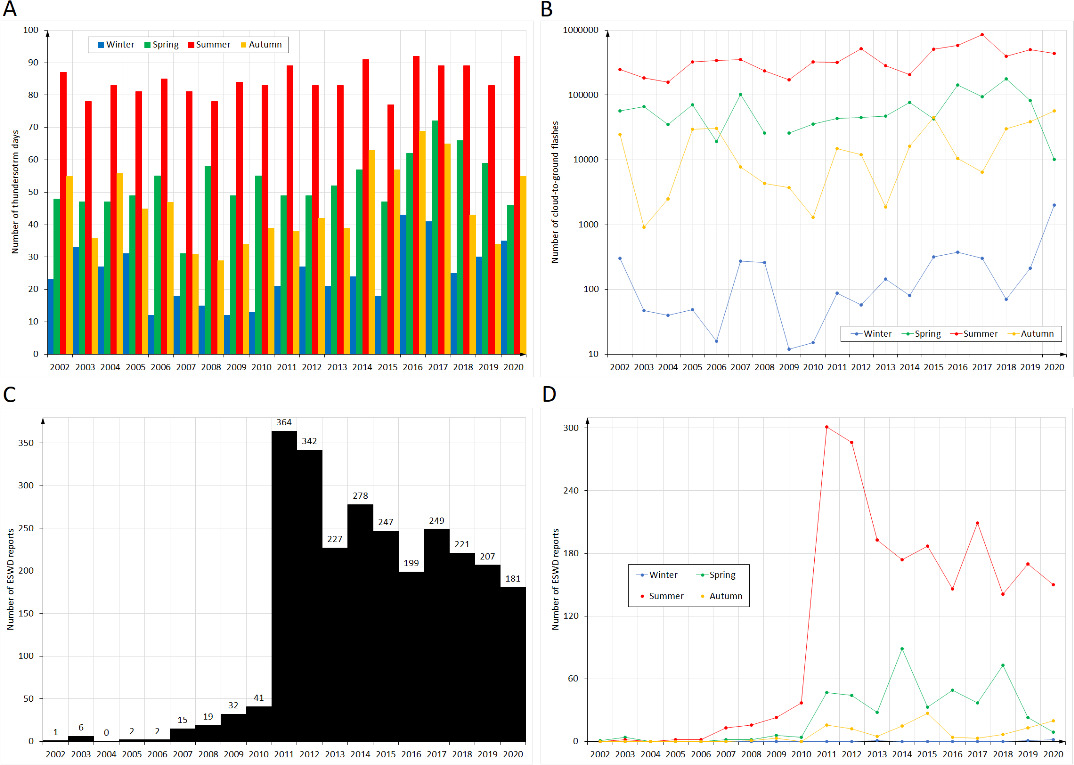
Speaking of thunderstorms, according to the AMS Glossary of Meteorology, a thunderstorm is a phenomenon classified based on the occurrence of lightning, often accompanied by other dangerous phenomena such as strong wind gusts, heavy rainfall, and hail (Byers, Braham 1949). Because the occurrence of thunderstorms is equivalent to the occurrence of lightning, they should be given special attention, as in this study. Earlier studies concerning the spatial distribution and intensity of lightning discharges in Poland have shown that the greatest electrical activity occurs in central Poland. Each year, the PERUN system records about 480,000 cloud-to-ground lightning flashes in the entire country (Sulik 2022). An increase in the number of lightning flashes each year across the country has also been confirmed (Fig. 1A). The constant activity of thunderstorm phenomena is also evident in the number of days with thunderstorms. Thunderstorm phenomena often contribute to a large number of property losses, usually associated with patchy, local wind gusts in the case of linear formations, or large hailfall associated with supercells (Groenemeijer et al. 2017; Taszarek et al. 2019b; Pilguj et al. 2022).
The temporal and spatial distributions of days with thunderstorms and their electrical activity can also be seen in reports from the hazardous weather database (ESWD; Dotzek et al. 2009). Thanks to the European Weather Observer (EWOB) system managed by the European Severe Storms Laboratory (ESSL), users of the application can send information about weather events of various types. The reports shown in Figures 1C and 1D reflect a phenomenon known as damaging lightning, which is most often associated with property damage caused by cloud-to-ground lightning. Every year throughout Europe, storms cause millions of euros in damages, and in Poland alone, between 2002 and 2020, 50 people died and 408 were injured by lightning strikes. The relationships of a warming climate to violent atmospheric phenomena are important; this study aims to determine the thermodynamic and kinematic conditions under which thunderstorms generating cloud-to-ground flashes are formed in Poland.
2. Dataset and methodology
2.1. Lightning data
Lightning data were retrieved from the PERUN lightning detection and localization system managed by the Institute of Meteorology and Water Management, National Research Institute (IMGW-PIB). The system is part of the European SAFIR (Surveillance et d’Alerte Foundre par Interferometric Radioelectrique) system, but the Polish part of the system was nicknamed to refer to the Slavic god of lightning, Perun (Gieysztor 2006). The system has been in continuous operation since 2002 and detects intra-cloud, cloud-to-cloud, and cloud-to-ground lightning. Detection system is based on triangulation and applies the technique of detecting the direction finding signal (Bodzak 2006). The entire system currently consists of 13 stations evenly distributed throughout the country (Fig. 2).
Fig. 2.
Hypsometric map of Poland based on the Shuttle Radar Topography Mission Global Coverage (SRTM3; Farr et al. 2007). Symbol points denote the locations of the PERUN lightning detection sensors with 100-km buffer zones (red circles).
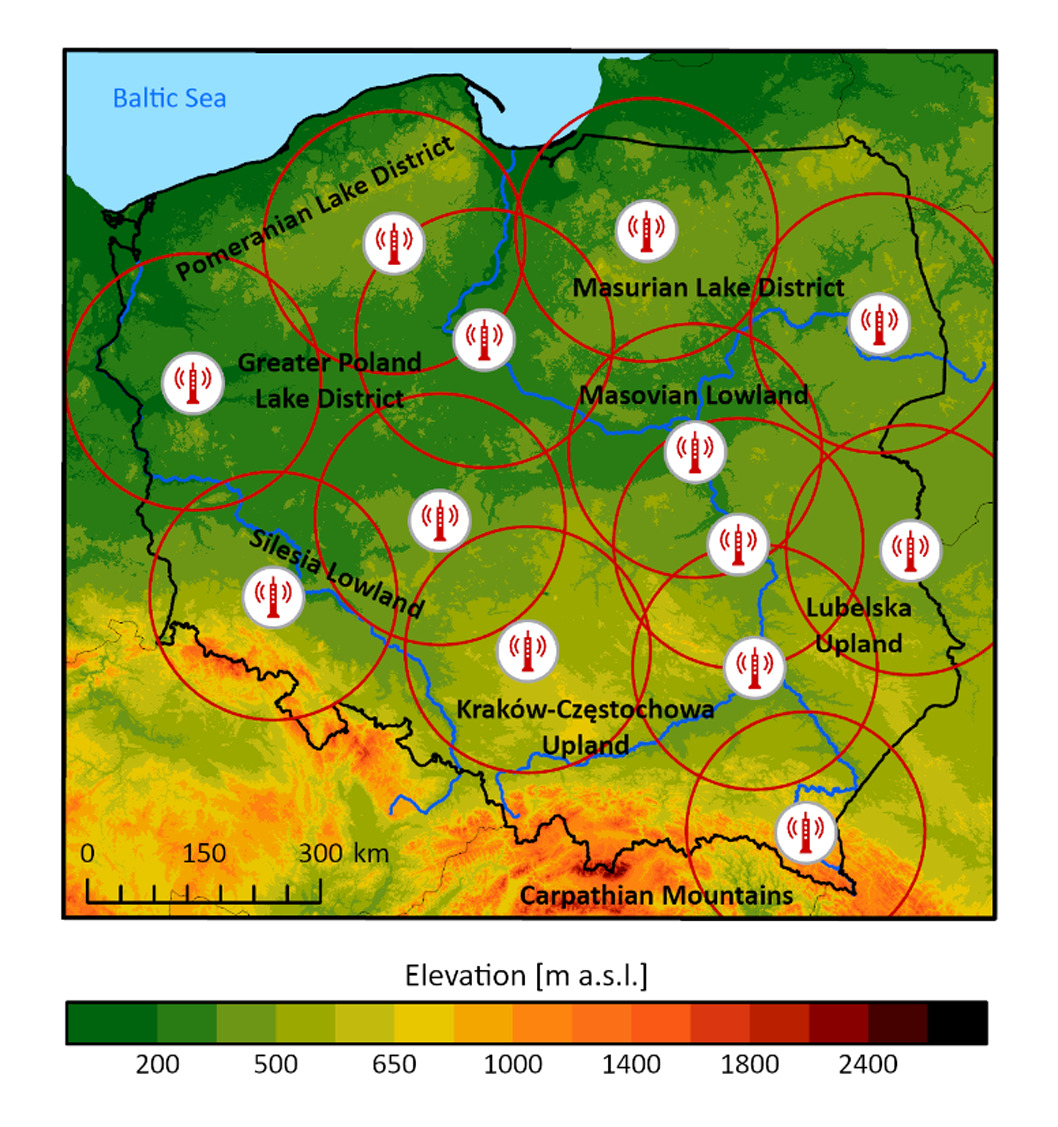
Over 95% of the country’s coverage area, the precision of discharge detection is less than 1 km. This resolution is being systematically reduced by replacing detectors to enable more precise detection of lightning flashes.
This research is based on a grid of 10 × 10 km (an area of 100 km2) so as to address the discharge-area relationship as precisely as possible (Diendorfer 2008). Previous studies on the spatial distribution of lightning in Poland were based on the same grid dimensions (Taszarek et al. 2015; Sulik 2021; Poręba et al. 2022; Sulik 2022). In Europe, the authors used various grid sizes, but the 10 × 10 km dimensions were most often chosen so that results from different locations around the world would be comparable. The authors of various studies chose different ranges of years, or the dimensions of the base field needed for statistical calculations and the determination of the spatial distribution of the discharges. A number of studies on lightning climatology have been prepared for Europe. The most frequently chosen primary field was a grid of 10 km × 10 km, 20 km × 20 km, 0.1° × 0.1° (approximately 10 km ×10 km), 0.2° × 0.2° (approximately 20 km × 20 km), and 5 km × 5 km (e.g., Schulz et al. 2005; Soriano et al. 2005; Betz et al. 2009; Biron et al. 2009; Enno 2011; Mäkelä et al. 2011; Novák, Kyznarová 2011; Santos et al. 2012; Feudale et al. 2013; Pohjola, Mäkelä 2013; Wapler 2013; Taszarek et al. 2015; Kotroni, Lagouvardos 2016; Sulik, Kejna 2022). In the United States of America, Koehler (2020) used a grid resolution of 926 m × 926 m and all counts were summed over subsets to yield counts on a coarser grid with 3704 m × 3704 m resolution. As a result, the maximum CG flash values were found over Tampa, Florida. Importantly, several locations in California had no lightning flashes during the 26-yr period.
Because of the low risk of harm from inter-cloud flashes and the system’s errors in detecting them, we decided to use only CG flashes. As shown in a study by Cummins et al. (1998), some CG discharges below 10 kA can often be identified by the system as cloud discharges, so they were removed. Also, if a discharge occurred several times at the same location, it was treated as an error, and only the first flash was taken into account. The whole raw dataset derived from IMGW-PIB was reorganized in the R programming language (R. Core Team 2014) and all maps were prepared in ESRI ArcGIS PRO 3.1.3 software.
2.2. Reanalysis data
Professional Numerical Weather Prediction (NWP) products and, in this case, widely used reanalyses were included in this study. The principle of reanalysis is based on combining data from numerical models with observations made at synoptic stations. Also included are measurements made by automatic stations or, in this case, vertical atmospheric soundings. The result is a coherent dataset based on the laws of physics. Data assimilation is done by combining previous predictions with new observations to get the most accurate estimate of the state of the atmosphere. Working backward, improved versions of the original observations are used, which, combined with the lack of timely conditions for the release of the model forecast, have a positive effect on the quality of the final product.
We decided to use a proven and accurate reanalysis of convective parameters derived from the ERA5 product managed by ECMWF (ERA5; Hersbach et al. 2020). The study area is all of Poland, so it was necessary to use a wide range of grids so that Poland is completely covered by the reanalysis data.
The ERA5 data were created in a 0.25° grid; the time step is hourly (Table 1).
Table 1.
Characteristics of ERA5 reanalysis data used in research.
To analyze situations in which lightning is generated, specialized parameters were selected to determine the state of the atmosphere at a given time. The standard parameters were air temperature, dew point temperature, convective precipitation, precipitable water amount, or parameters related to humidity at heights of 0-2 km and 2-5 km above the ground surface. Convective parameters related to thermodynamics and kinematics were separated for the most unstable air parcel (MU) along with virtual temperature correction (Doswell, Rasmussen 1994). Thermodynamic and kinematic variables included in the study are convective available potential energy, convective inhibition, lifted condensation level with height and temperature, lifted index, mixing ratio, geopotential height, and bulk wind difference. The specific parameters for analysis are WMAXSHEAR (see Table 2) and hail size index (HSI), which have been used in previous studies related to climatological aspects of convection over Europe. The WMAXSHEAR parameter is used in forecasting severe thunderstorms; it consists of components such as the square root of 2 times CAPE (Convective Available Potential Energy), multiplied by 0-6 km wind shear, as implemented by Taszarek et al. (2020). The HSI parameter developed by Czernecki et al. (2019) is used for predicting large hail precipitation over Europe. The selected convective parameters were chosen to best and most accurately represent the conditions of lightning formation. The list of parameters derived from the ERA5 data is presented in Table 2. In addition, the trends of some variables were calculated for the period 1940-2022 to show the variability over time of the parameters responsible for convection in Poland.
Table 2.
List of convective parameters used in research.
| Abbreviation | Full name | Units |
|---|---|---|
| MUCAPE | most-unstable convective available potential energy | J•kg-1 |
| MUCIN | most-unstable convective inhibition | J•kg-1 |
| MULCL H | most-unstable lifted condensation level height | m AGL |
| MULCL T | most-unstable lifted condensation level temperature | °C |
| MULI | most-unstable lifted index | K |
| MUMIXR | most-unstable mixing ratio | g/kg |
| MUHGT | most-unstable geopotential height | m AGL |
| MUWMAXSHEAR | square root of 2 times CAPE multiplied by bulk wind difference based on a formula from Taszarek et al. (2017) | m2/s2 |
| ISO 0 H | 0 Celsius isobar height | m AGL |
| PW | precipitable water amount (entire column) | mm |
| RH02 | 0-2 kmabove ground level mean relative humidity | % |
| RH25 | 2-5 kmabove ground level mean relative humidity | % |
| BSEFF | bulk wind difference (shear) | m•s-2 |
| HSI | hail size index formula from Czernecki et al. (2019) | - |
| T2M | 2 m above ground level air temperature | °C |
| TD2M | 2 mabove ground level dewpoint temperature | °C |
| CP | ERA5 1-h accumulated convective precipitation | mm•h-1 |
3. Results
3.1. Cloud-to-ground lightning and thunderstorm days
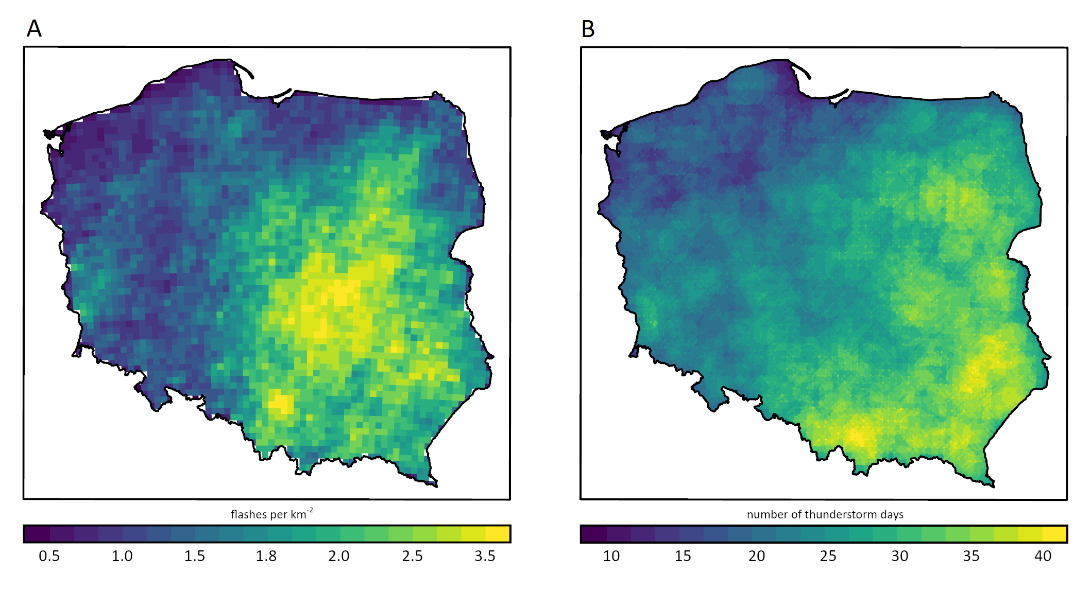
The spatial distribution of lightning and the number of thunderstorm days varies across Poland. The smallest number of TDs occurs in the Baltic Sea area in the north of the country (10-15 days/year), and the largest in the southeastern part (35-40 days/year)(Fig. 3B). On the other hand, if we look at the electrical activity of thunderstorms we can note their greatest distribution in the central part of the country (Kielce Upland through Masovian Lowland)(Fig. 3A). During the 18 years of PERUN’s operation, more than 8,626,000 CG strikes were detected and located in Poland.
Fig. 3.
A. The average annual number of CG lightning flashes per km-2 computed for 10 km × 10 km grid cells during 2002-2020. B. The average annual number of thunderstorm days during 2002-2020, computed for 1 km × 1 km grid cells within a radius of 15 km from the bin center. The maps are based on lightning data derived from the PERUN network.
Thunderstorm activity in Poland in terms of the occurrence of TDs and their electrical activity does not deviate from the climatological regularities that characterize the Polish climate (Kejna, Rudzki 2021). Thunderstorms are most numerous from May to the end of August, but their number is also pronounced in September. The period from October to March is the period of least thunderstorm activity, but there are instances of uplift of single convective cells in these months. The electrical activity of thunderstorms during the cooler period of the year is sporadic (Fig. 4). In terms of both the number of CG discharges generated and the number of days with thunderstorms, there is a noticeable increase in both variables especially in June and July. As shown in a study by Poręba et al. (2022) over a similar period of PERUN system operation, the highest hourly thunderstorm activity was during 1400-1500 UTC, and the lowest during 0700-0800 UTC. It is noteworthy that electrical activity during nighttime storms in autumn is greater than in spring and summer.
Fig. 4.
A. Annual distribution of CG flashes during 2002-2020 by monthly cross-section. B. Annual distribution of TDs during 2002-2020 by monthly cross-section. Based on lightning data derived from the PERUN network.
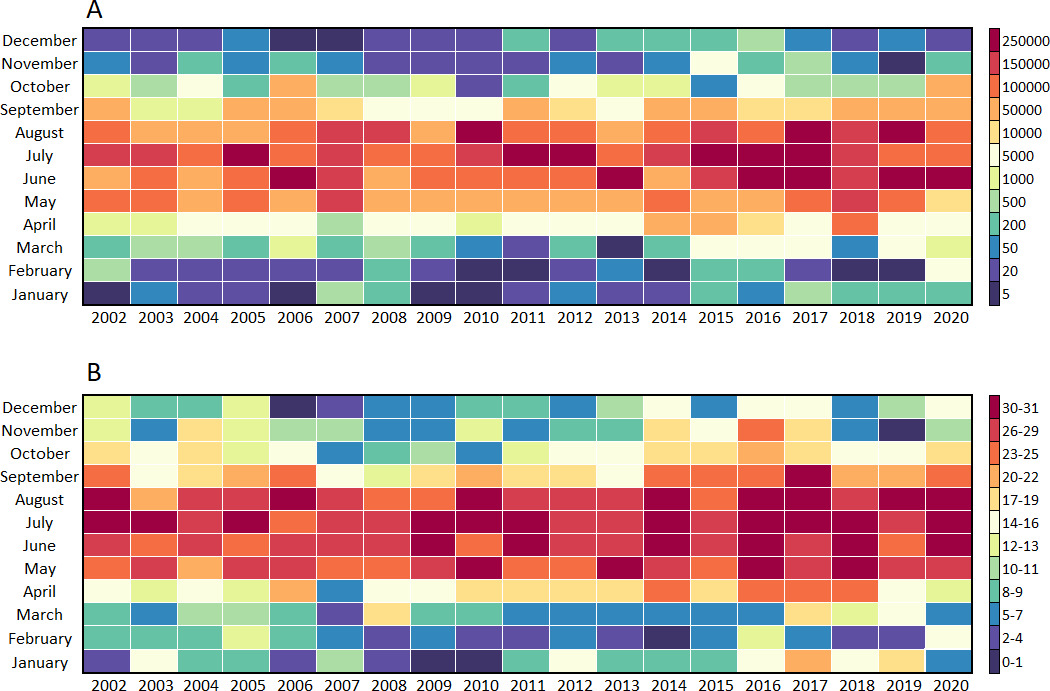
Considering the distribution of the number of CG discharges during the year, it should be noted that the frequency of discharges varies within and between months that experience thunderstorms. Abnormal numbers of CG discharges are seen primarily in June, July, and August. The days with the highest electrical activity in Poland are summarized below (Table 3). During some days with thunderstorms, the electrical activity of cumulonimbus clouds is very high, and such a distribution can determine the number of discharges recorded by the detection system, which sometimes directly affects the annual distribution. When interpreting the meteorological conditions in which thunderstorms generating elevated CG values arise, it is, therefore, necessary to focus directly on their frequency and the number of days on which extremes of this type occur.
Table 3.
The top 8 days with highest electrical activity over Poland during 2002-2020, calculated for 10 km × 10 km grid cells derived from the PERUN system. Dates are expressed as DD.MM.YYYY.
3.2. Annual variability of CG lighting flash environment
This section of the paper presents the convective conditions under which storm clouds generate ground-based lightning. The convective parameters were derived from ERA5 reanalysis only for thunderstorm days in which at least one CG flash occurred, so convection during the cold period (such as snow convection) was not considered.
The main factors in the build-up of a cumulonimbus storm cloud are favorable thermodynamic and kinematic conditions. Variables relating to thermodynamics are mainly CAPE and Mixing Ratio, which is a measure of the water vapor content of the air (Riemann-Campe et al. 2009). For both CAPE and Mixing Ratio, larger values indicate a more moisture-rich boundary layer, which, along with altitude, may have a greater capacity to release energy through condensation. Even average CAPE values will not be sufficient if there is no initiation of convection positively supported by favorable kinematic conditions. These kinematic conditions can be represented by the Deep Layer Shear (DLS), which is the difference in wind speed at 0-6 km above the ground surface, and the product of the MU CAPE and DLS variables, i.e., WMAXSHEAR developed by Taszarek et al. (2020).
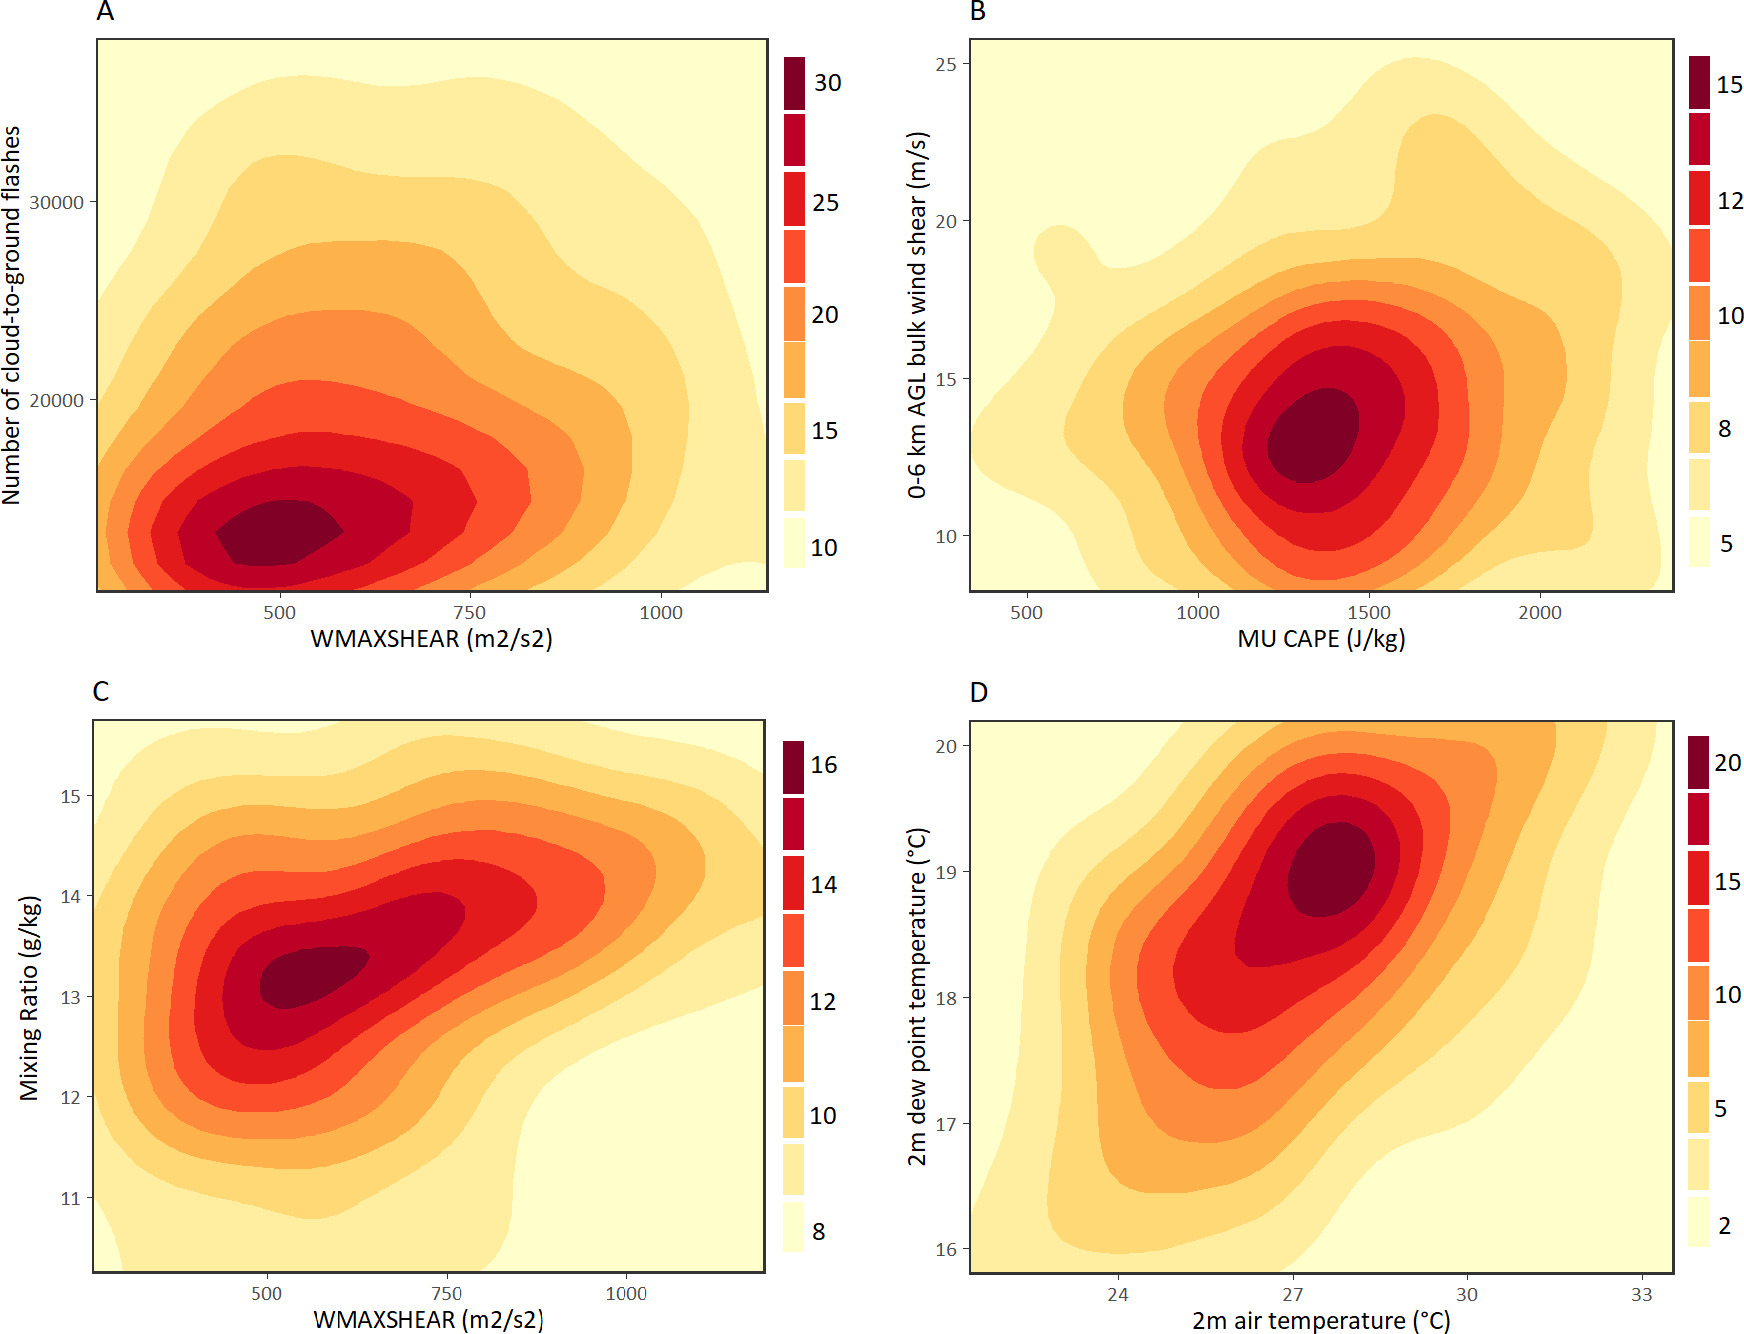
As presented in Figure 5A, CG frequencies >30,000/d occur, although they are not very numerous. Thunderstorms generating ~10,000 CG/d are the most numerous, and classified as moderate. A section (3.4) of this paper is devoted to this issue. However, when it comes to the thermal and kinematic conditions accompanying the generation of CG discharges, they are most often formed under WMAXSHEAR conditions of about 500 m2/s2. Of course, stronger thunderstorm systems have values as high as 1,000 m2/s2, but these occur sporadically. The highest frequency of thunderstorms is best described by the relationship between DLS and MU CAPE (Fig. 5B). Whereas CAPE values in the range of about 1500 J/kg are elevated values for Poland, it is under such conditions that the potential for generating discharges is favorable. The values of kinematic conditions most often fall in the vicinity of 13-14 m/s in the 0-6 km AGL profile. As in the case of the relationship of the number of CG discharges to the WMAXSHEAR index, the key element is the mixing ratio. A mixing ratio in the range of 13 g/kg, superimposed with favorable thermodynamics (WMAXSHEAR above 500 m2/s2), results in increased CG flashes (Fig. 5C). The most important and crucial aspects of storm cloud development take place above the height of lifted condensation level (LCL) and level of free convection (LFC). On the other hand, the layer near the surface also shows variables that indicate an increased potential for CG flashes, which is favorably influenced by an elevated air temperature above 27°C and a dew point temperature around 19°C (Fig. 5D).
Fig. 5.
A. Relationship between the number of CG flashes and WMAXSHEAR. B. Relationship between wind shear and MU CAPE. C. Relationship between mixing ratio and WMAXSHEAR. D. Relationship between 2 m dew point temperature and 2 m air temperature. Computed from PERUN and ERA5 data for thunderstorm days during 2002-2020.
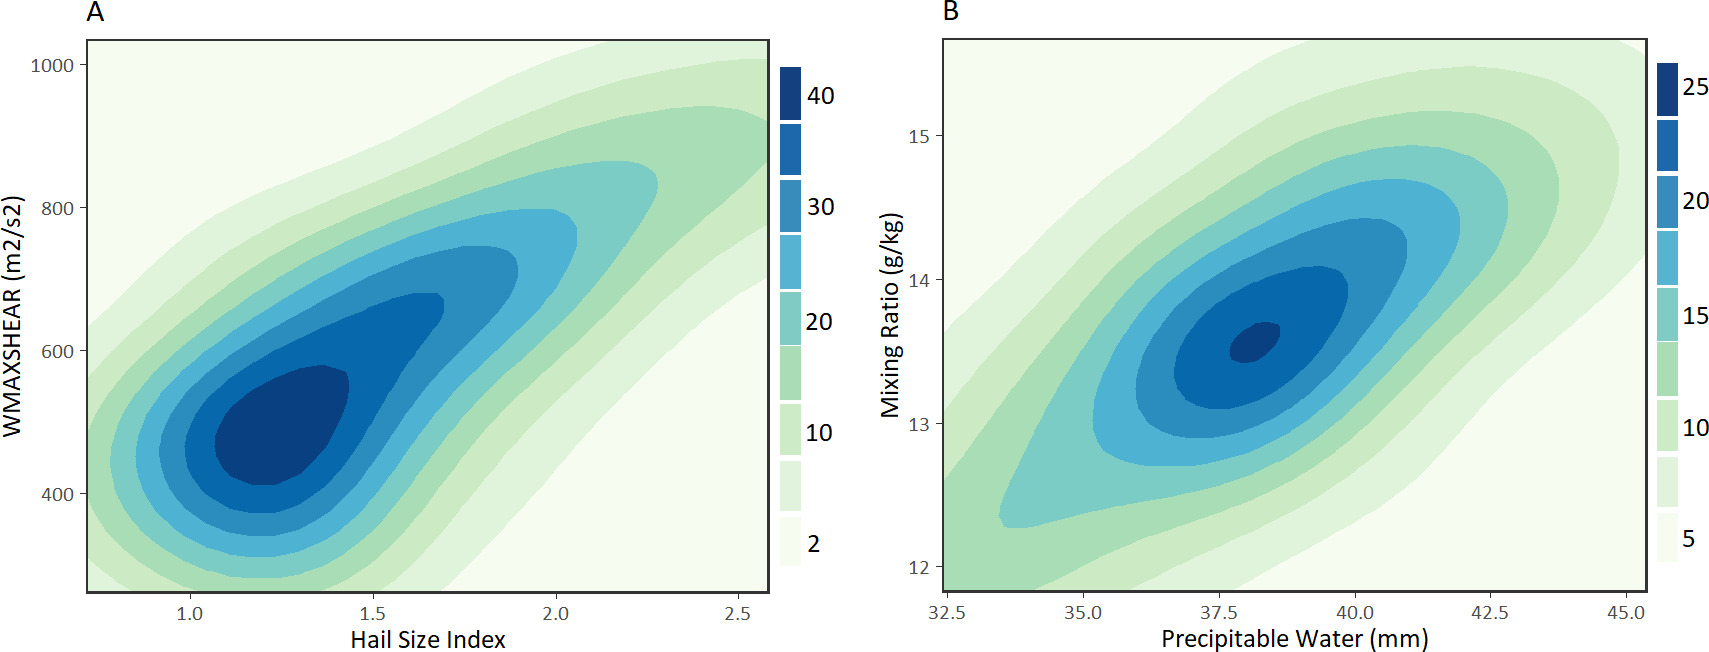
In the process of CG formation, an essential component is the moisture contained in the lower tropo-sphere (Farnell, Rigo 2020). The moisture and updraft favorably influence the formation of hail inside the convective core. Therefore, the HSI developed by Czernecki et al. (2019) was used in the study. This parameter determines the potential hail diameter based on remote sensing data and kinematic and thermodynamic conditions in the troposphere. Previous studies have proven that hail is formed inside cumulonimbus clouds when strong ascending currents result in rapid cooling of water droplets in the troposphere (Allen 2018). As confirmed by studies on supercells and linear systems, the moisture content and thermal gradient in the vertical profile of the troposphere are regulated by vertical wind shear, which simultaneously contributes to updraft velocity. Higher vertical velocity promotes not only lightning but also hail precipitation (Doswell 2001; Coffer, Parker 2015; Lin, Kumjian 2021). Consequently, storm cells, and especially supercells, which typically produce large hail, generate greater amounts of ground discharge. Also, moderate DLS and WMAXSHEAR values are noted in supercell structures (Fig. 6A). Supercell thunderstorms that generate large hail are mainly responsible for heavy rainfall, often exceeding 40 mm/h (Fig. 6B) and tornadoes. Occurrence of a supercell is usually manifested by an increased number of CG flashes. A study performed by Poręba et al. (2022) also showed a positive relationship between supercell compo-site parameter (SCP) and HSI.
Fig. 6.
A. Relationship between WMAXSHEAR and HSI. B. Relationship between mixing ratio and precipitable water amount. Computed from PERUN and ERA5 data for thunderstorm days during 2002-2020.
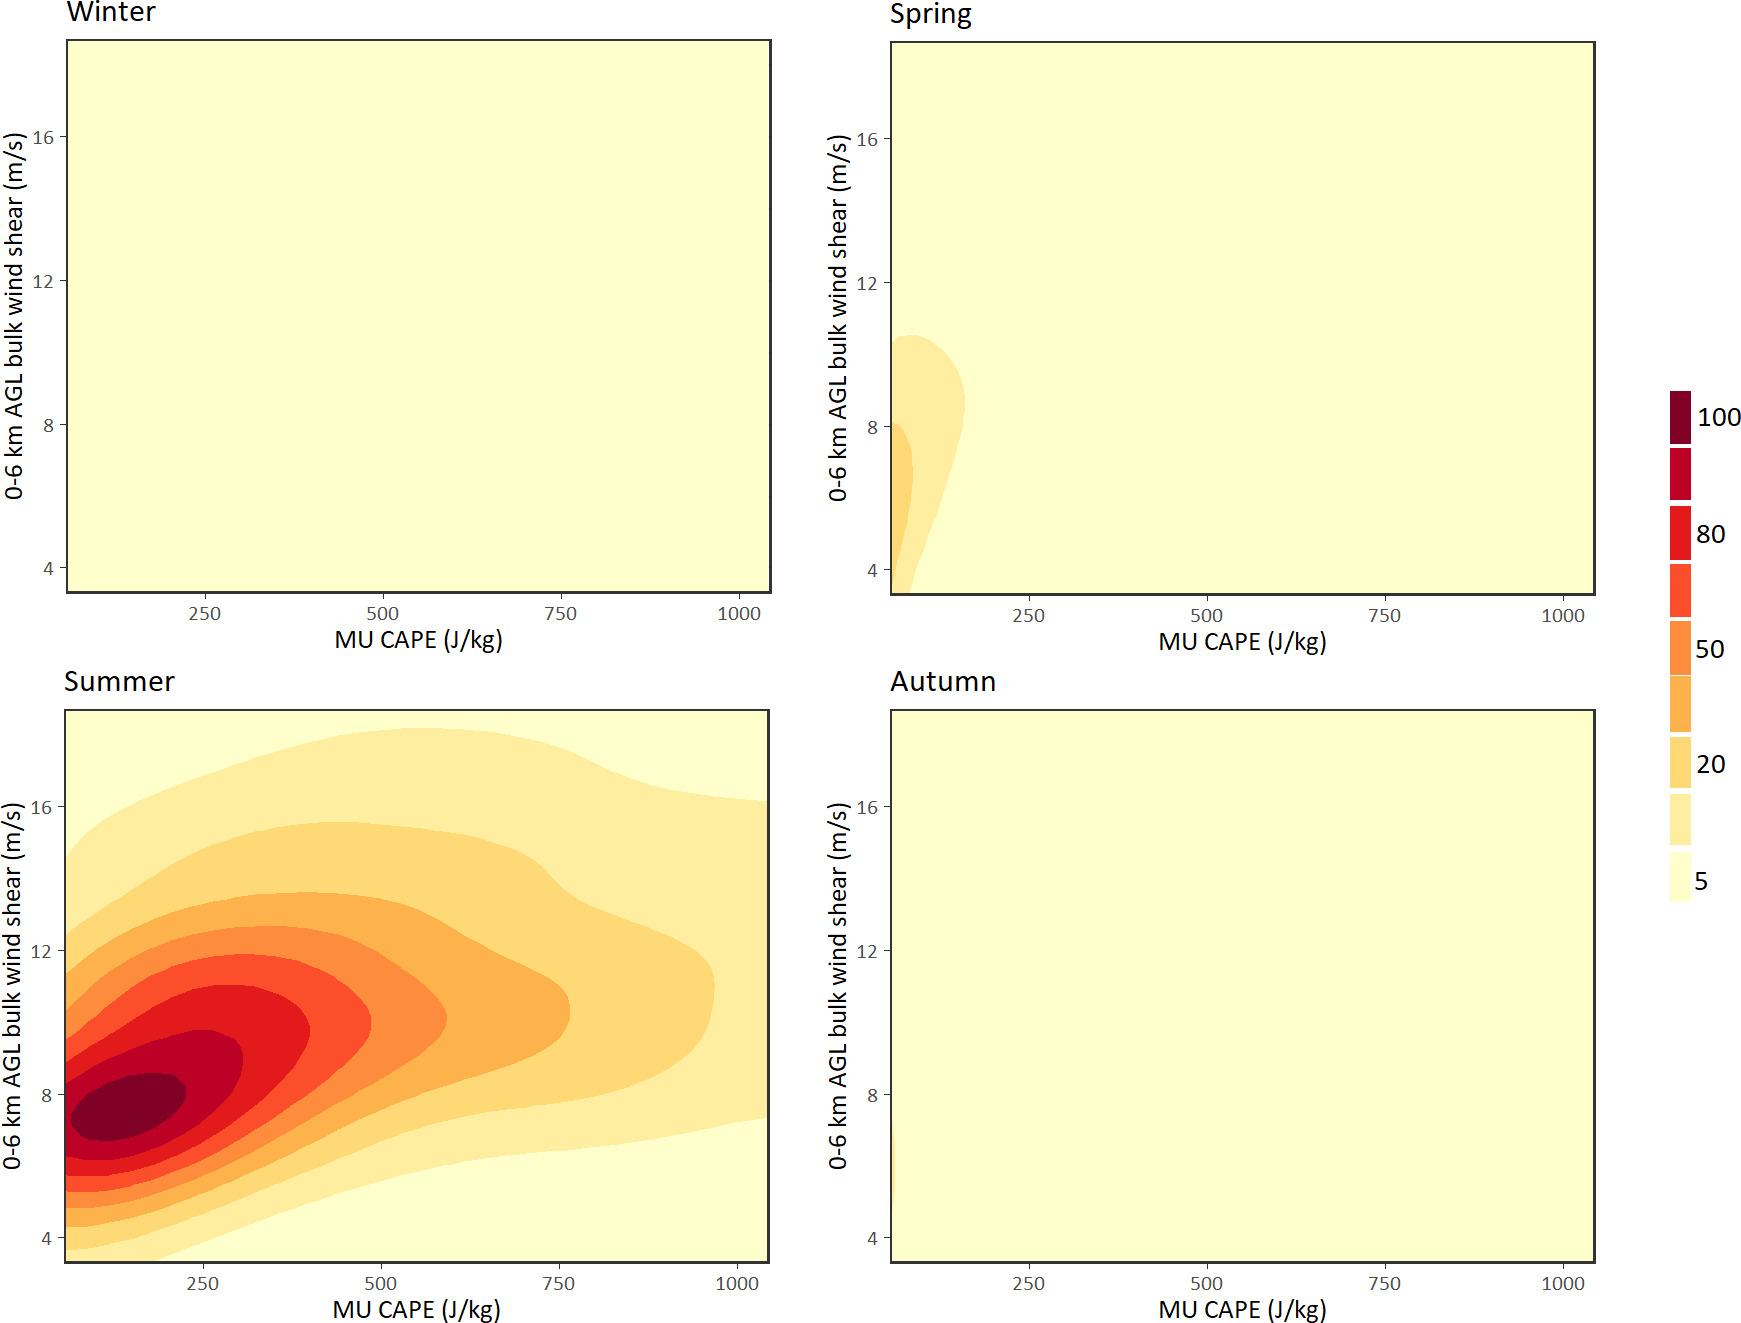
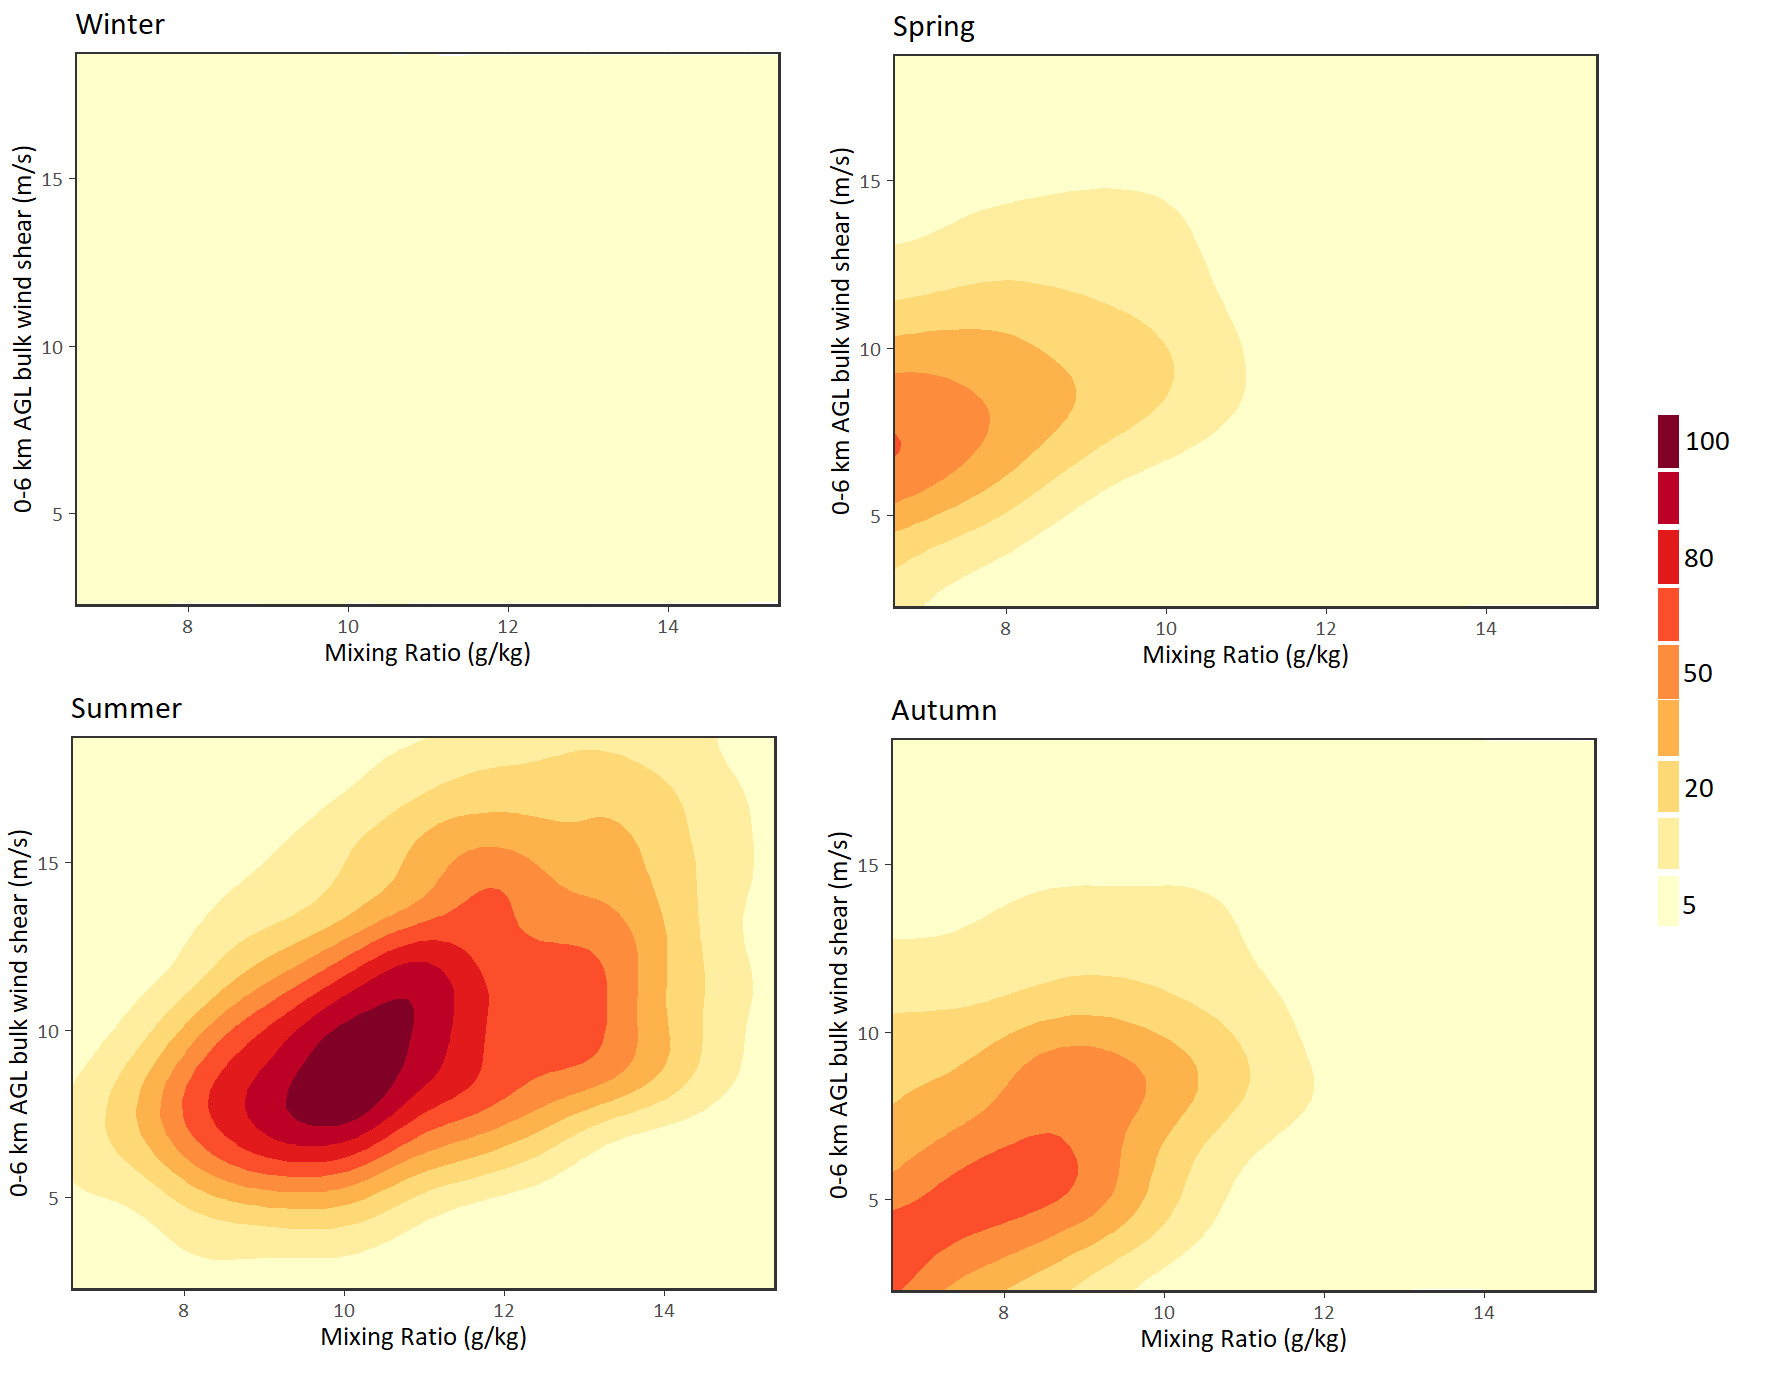
As mentioned earlier, the most frequent and intense thunderstorm activity in Poland occurs during the warmer period of the year, May through September. This is when the parameters favorable for convection are particularly elevated. In summer, even relatively moderate CAPE values combined with moderate wind shear create the potential for electrical activity. In spring, the relevant thermodynamic and kinematic conditions tend to be lower, and they are virtually nonexistent during autumn and winter. The infrequent thunderstorms in autumn and winter are manifested mainly in the form of linear convective systems characterized by stronger wind gusts, and less often by an increased number of CG flashes (Celiński-Mysław et al. 2020)(Fig. 7). As for the DLS and mixing ratio during thunderstorms, these variables are also most prominent in summer. The process of discharge formation is closely related to moisture content. As Wang et al. (2018) also note, the larger the moisture deposits in the lower troposphere, the faster the separation of charges in the storm cloud. When relative humidity (RH) increases above 60%, there is a significant increase in CG discharges relative to IC. The distribution and ratio of DLS to mixing ratio by season are shown in (Fig. 8).
3.3. Favorable conditions for deep moist convection
The most important factors enabling the formation of thunderstorms are sufficient moisture, unstable air mass, and wind shear. However, for convection to occur, it must be initiated (Doswell 2001). The factors that initiate convection most often occur in the form of atmospheric fronts during the summer months (Sulik 2021), while in winter, terrain and orographic forcing play a key role (Kolendowicz 2012). Climate change is manifest primarily through increasing air temperature near the earth’s surface. Increasingly, heat records are being observed not only in the warm season but also in winter, and systematic air temperature increase is evident throughout the country (Fig. 9).
Fig. 9.
Spatial distribution of average air temperature from 1940 to 2022. Long-term trends are derived from annual values in hourly resolution and corresponding Sen’s slope. X – a statistically significant trend. Computed from ERA5 reanalysis data.
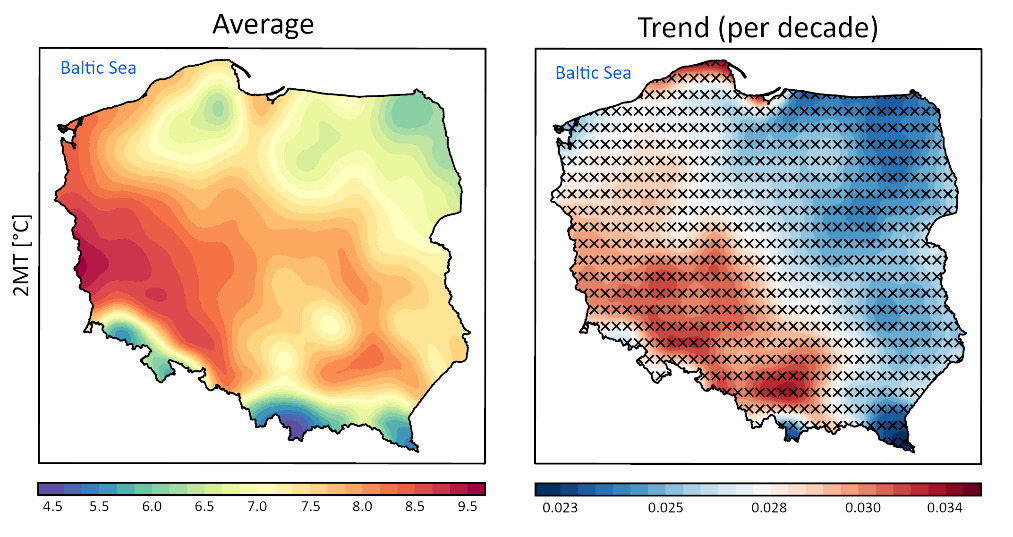
Rising air temperature leads to an increase in the heat capacity of the atmosphere. As a result, larger deposits of moisture can be stored. On the other hand, increasing air temperature can contribute to a decrease in relative humidity, which is essential for the formation of thunderstorms.
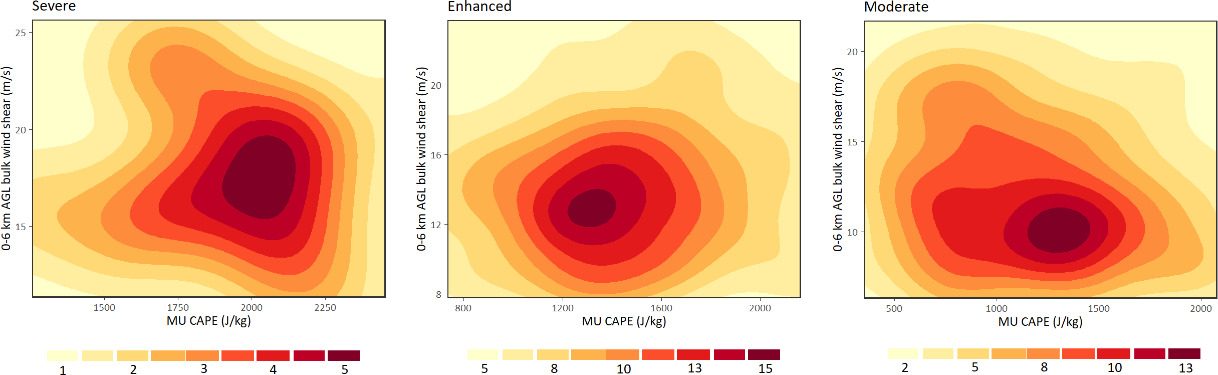
To reproduce as accurately as possible the thermodynamic and kinematic conditions for specific values of CG discharges, probabilities of occurrence of a given number of CG were separated. The probability was divided into 3 types: severe, enhanced, and moderate. The severe case refers to the most electrically active storms, with CG/d >50,000; enhanced is defined as storms with activity of 10,000 -50,000 CG/d; moderate is defined as storms with 5,000 -10,000 CG/d.
By analyzing specific variables over many cases, it is possible to determine parameters favoring the electrical activity of thunderstorms. The most intense thunderstorms are formed in the MU CAPE environment in the range of 1900-2100 J/kg and in the presence of kinematic conditions in the form of DLS from 16 to 20 m/s (Fig. 10). In the cases of enhanced and moderate category storms, a very similar environment is evident in both the values of unstable air mass and wind shear at 0-6 km AGL. These types of thunderstorms can form in the MU CAPE environment, usually above 1000 J/kg, not exceeding 1500 J/kg, with the simultaneous presence of DLS around 11 m/s.
Fig. 10.
Relationship between DLS and MU CAPE for the probability of increased electrical activity. Severe = lightning activity >50,000 CG/day. Enhanced =10,000-50,000 CG/day. Moderate = 5,000-10,000 CG/day.
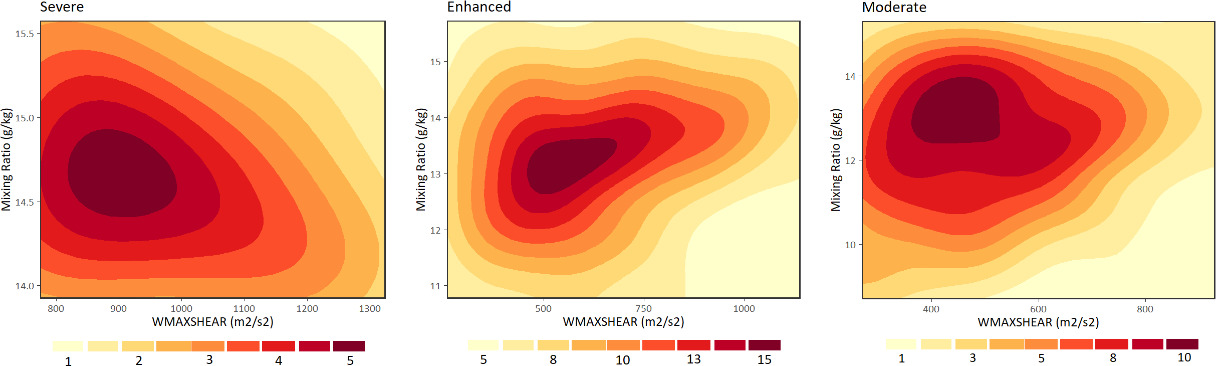
The ratio of mixing of moist air with dry air is similar for the three storm types analyzed, ranging from 13 g/kg to about 15 g/kg in severe storms. However, the greatest differences are in the WMAXSHEAR parameter, where storms generating severe CG values form in conditions ranging from 800 m2/s2 to 1300 m2/s2. For enhanced and moderate storms, the values of this parameter are between 400-700 m2/s2 (Fig. 11).
Fig. 11.
Relationship between mixing ratio and WMAXSHEAR for the probability of increased electrical activity. Severe = lightning activity >50,000 CG/day. Enhanced =10,000-50,000 CG/day. Moderate = 5,000-10,000 CG/day.
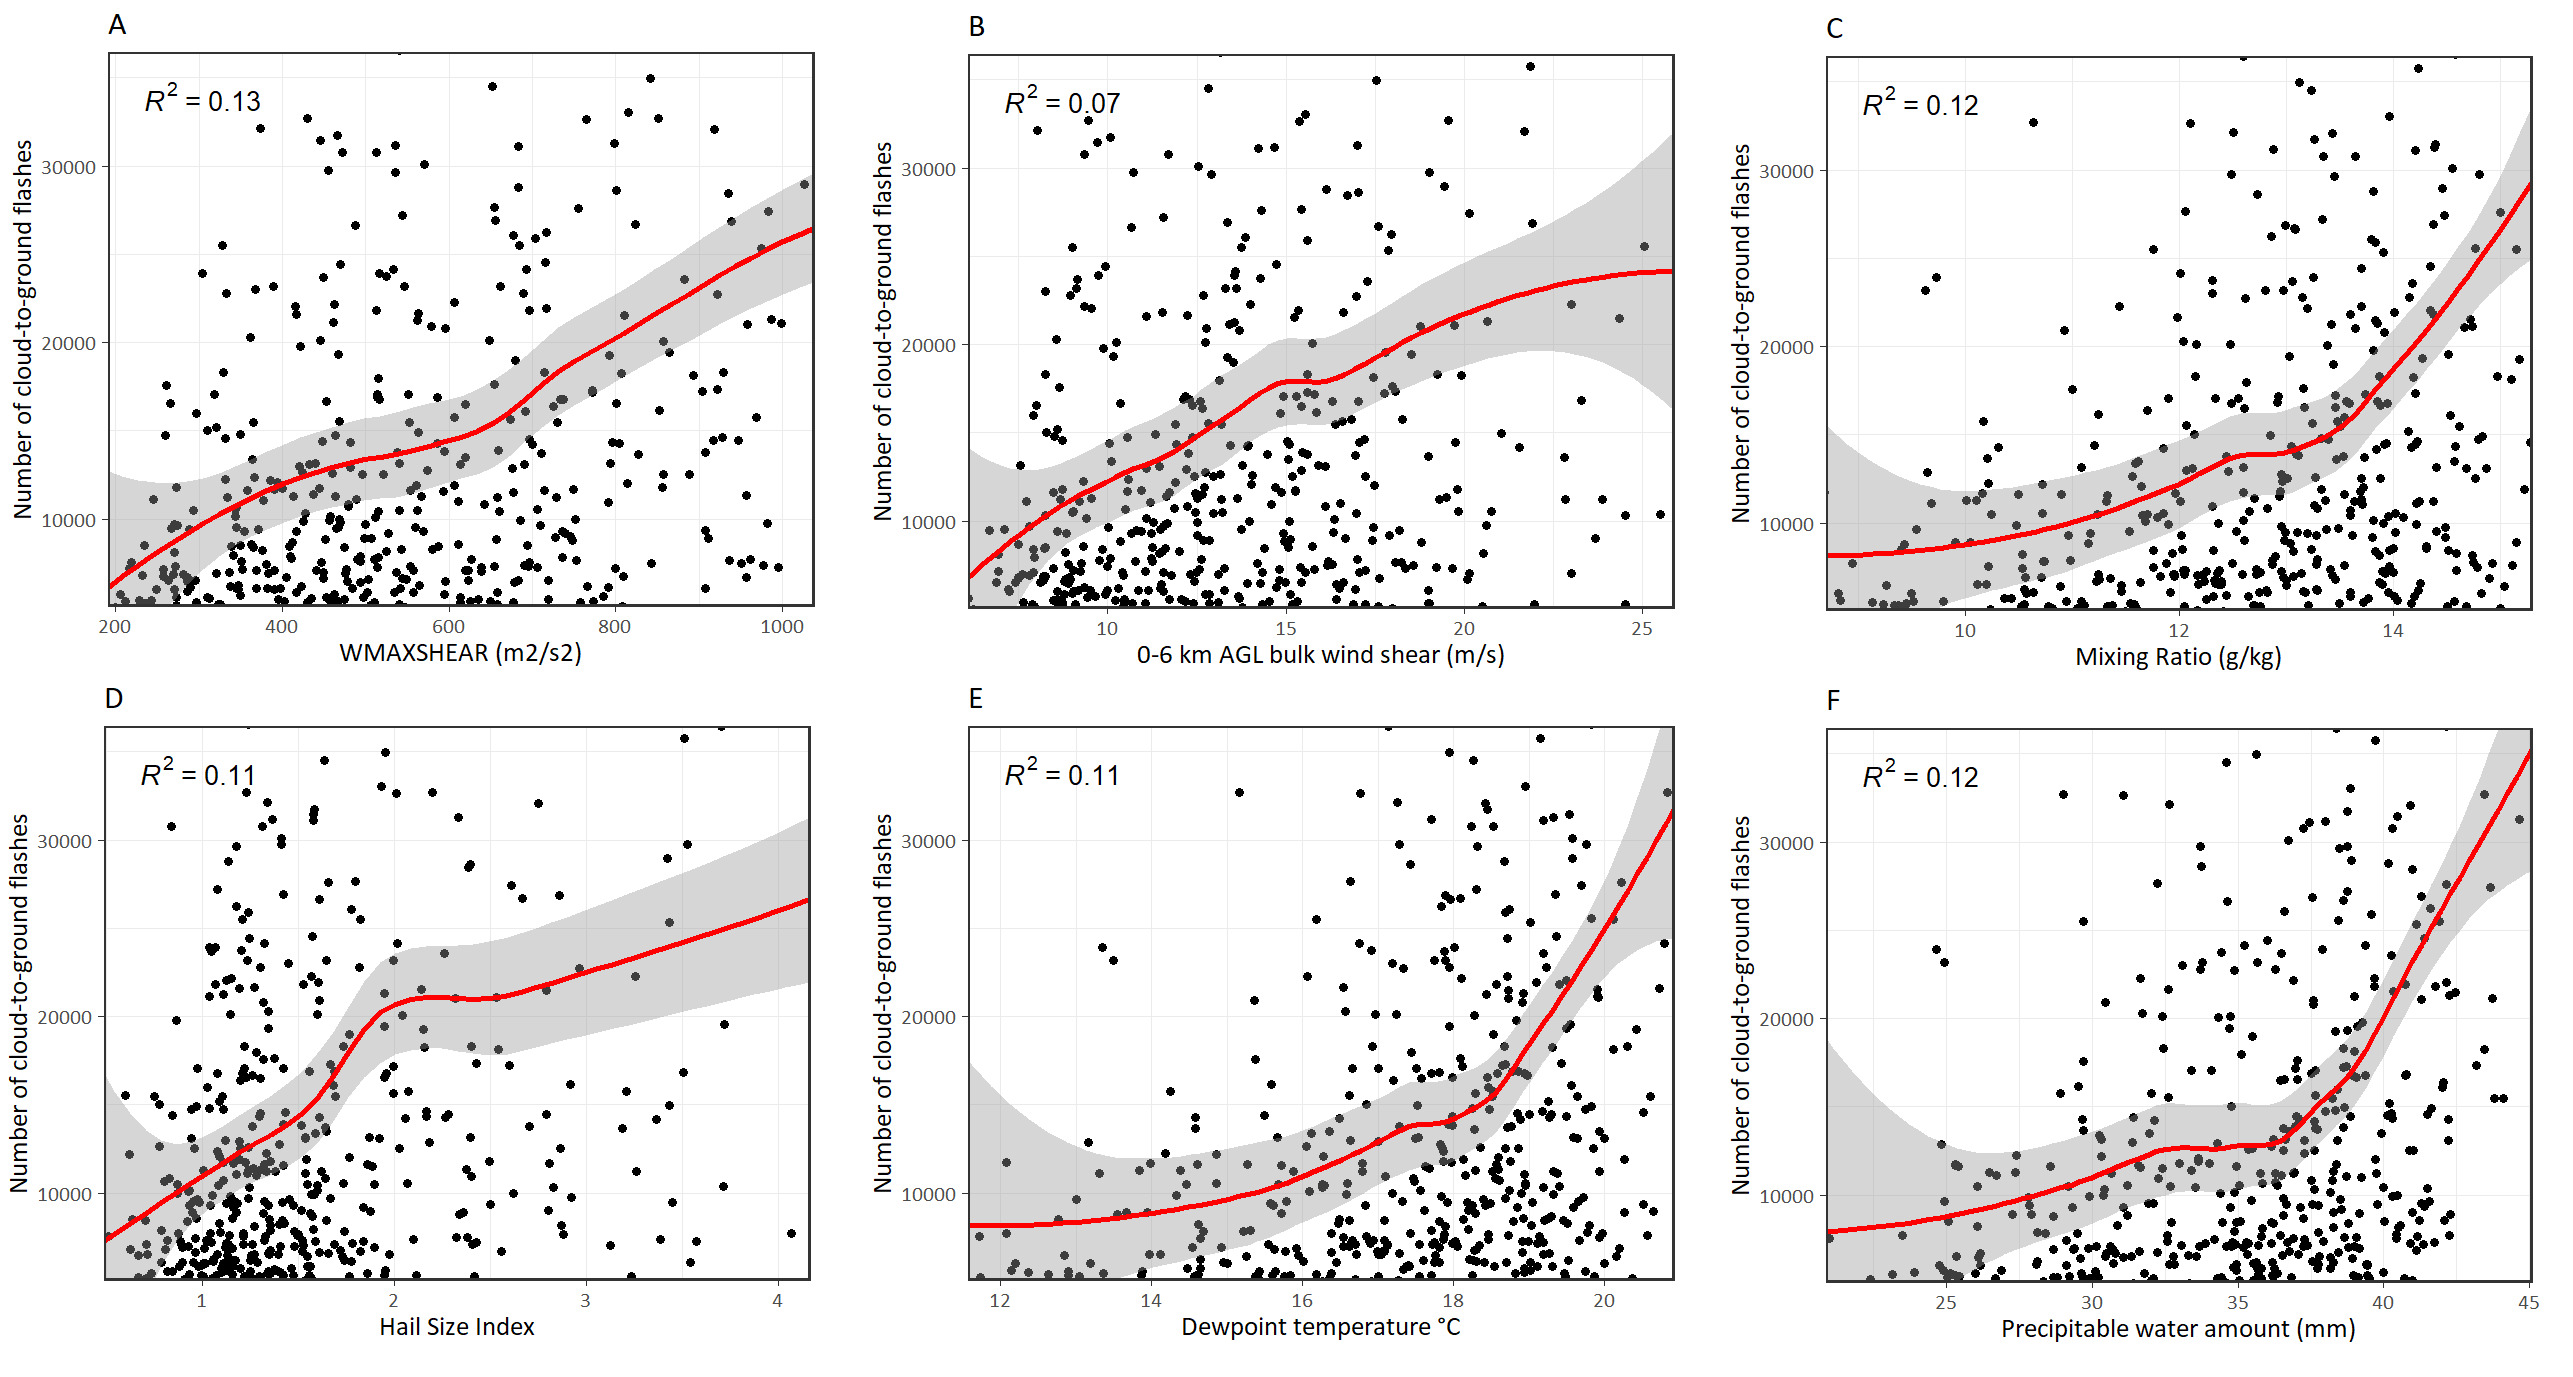
Since thunderstorms are formed in a rather complicated and complex way, the environment in which they form cannot be represented by a single variable. Among the most important are instability, moisture content, and vertical movements. It was therefore decided to present the variables necessary for convection in relation to the number of flashes formed on one panel (Fig. 12). Similar distributions can be observed for humidity-related variables (mixing ratio, dewpoint temperature and precipitable water). Humidity is important because severe thunderstorms usually occur in an environment of elevated dew point. Low values of this variable effectively inhibit the release of latent heat and significantly reduce the threat of organized multicellular systems. Advection of a significant portion of moisture to the boundary layer positively increases the instability of the atmosphere. An additional factor supporting convection is the relatively lifted condensation level (LCL), which, when overlapped with the WMAXSHEAR or DLS parameter, causes an increase in the velocity of the elevated air parcel and the simultaneous release of the energy it contains (Fig. 12 A, B). Convective instability is triggered when dynamic lift from the surface to mid-levels produces moist adiabatic lapse rates of air lifted from the lower troposphere and dry adiabatic lapse rates of air lifted in the middle troposphere. At the same time, strong vertical movements and the presence of fractions of water, ice, and ice crumble cause the formation of hail, which has a strong effect on the formation of lightning.
Fig. 12.
Relationship between convective parameters and cloud-to-ground lightning flashes A. WMAXSHEAR (product of DLS and MU CAPE); B. DLS (Deep Layer Shear; C. mixing ratio; D. hail size index; E. 2-meter dew-point temperature; F. Precipitable water. The red line denotes locally-estimated scatterplot smoothing. Grey bands are tolerance range.
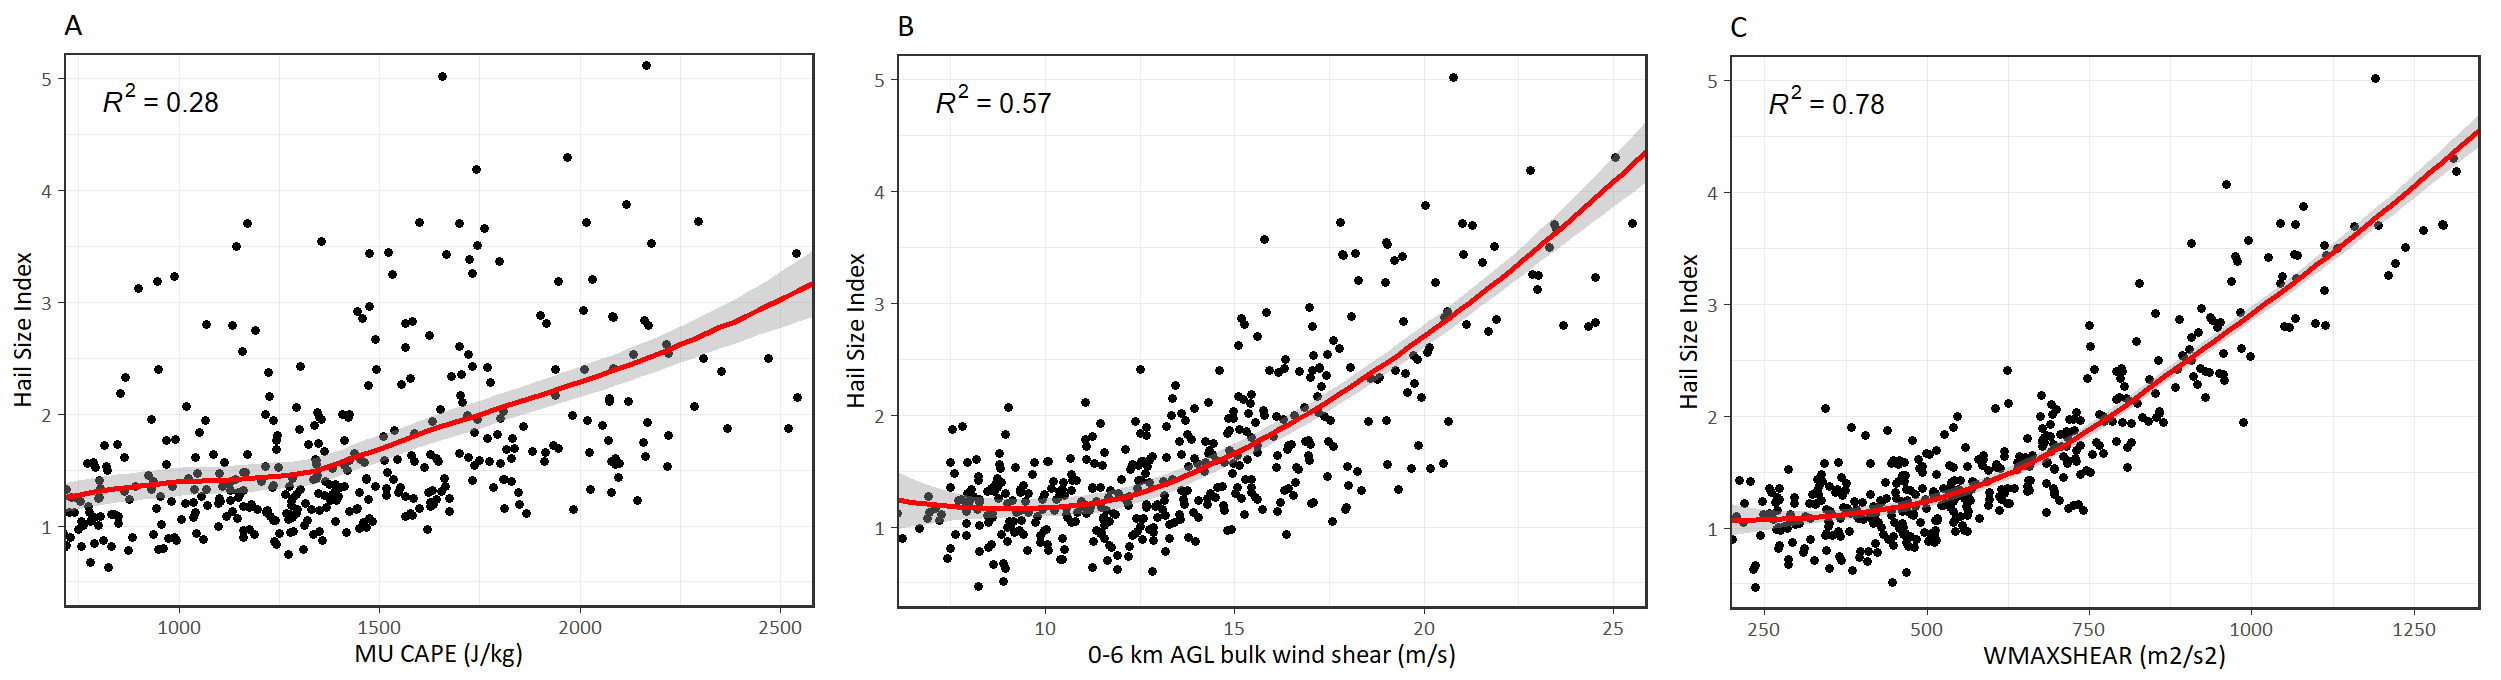
Extended storm systems, including supercells, often result in hail. Referring to previous studies, they showed a positive relationship between CG and hail (Soula et al. 2004). The number of discharges increases when hailfall occurs (Lang et al. 2004; Soula et al. 2004). Elevated instantaneous electrical activity (lightning jump) can also be linked to hail formation inside the convective core (Kane 1993; Williams et al. 1999). In turn, as noted by Changnon (1988), storms of a cold front nature generating hail are characterized by increased electrical activity. Hail production inside the cumulonimbus cloud is therefore crucial for lightning occurrence, and as analysis has shown, HSI (Czernecki et al. 2019) correlates very well with thermodynamic and kinematic parameters (Fig. 13). An unstable air parcel develops when it becomes warmer than its surroundings and at the same time gains lift due to positive buoyancy. An additional factor supporting vertical displacement is wind uplift, that is, the change in wind speed and direction with altitude. Although HSI is well-correlated with CAPE and DLS, the best choice for determining the relationship regarding CG formation and associated hail is the WMAXSHEAR parameter, which contains thermodynamic and kinematic variables (Fig. 13C). As confirmed in an earlier study by Taszarek et al. (2020), the frequency of hazardous convective phenomena is increasing over Europe with the development of WMAXSHEAR and low-level lapse rates.
3.4. Spatial-temporal changes of convective parameters
Determining the convective conditions that favor the formation of cumulonimbus clouds is crucial to understanding the processes taking place in the troposphere. It is no less important to determine the spatial and temporal changes taking place over the years in a given area. The latest climate report of the Intergovernmental Panel on Climate Change (IPCC 2023) confirmed a statistically increasing trend in air temperature measured at 2 m above ground level. Moreover, global changes are progressing fastest on land. Climate change associated with increasing air temperature is indirectly associated with changes in the convective environment in the higher parts of the troposphere and may favorably influence the development of hazardous storms (Brooks et al. 2003; Taszarek et al. 2017; Taszarek et al. 2020). In Poland, the parameters related to convection over the years correspond to the number of storms. Mixing ratio values in the area of the Tatra Mountains are lower than in the mountainous area of southeastern Poland (Fig. 14). Higher elevations result in greater dry stability and thus can foster increasingly steep vertical air temperature gradients.
However, the increase in air temperature also leads to a decrease in relative humidity and, thus, deeper and deeper mixing of the boundary layer (Byrne, O’Gorman 2016). However, it is important to keep in mind that the mere presence of an unstable air parcel is not sufficient; rather, for convection to occur, the processes that initiate it must also be present. Vertical wind shear is extremely important in terms of the organization and evolutionary potential of uplifted storm cells (Allen et al. 2015; Pucik et al. 2015); in this study, it was vectorized by the difference in wind speed and direction between the ground surface and a height of 6 km because typically the highest updraft velocities in storm clouds occur in this layer. The overlap of potential energy along with vertical air movement indicates a continuous increase in these parameters at the scale of Poland, and a systematic increase even greater than the alarming increase in air temperature (Fig. 15).
Fig. 14.
82-yr climatology of 95th percentile MU CAPE, MU mixing ratio and MU WMAXSHEAR for Poland. Long-term trends are derived from annual values in hourly resolution and corresponding Sen’s slope (values denote change per decade).
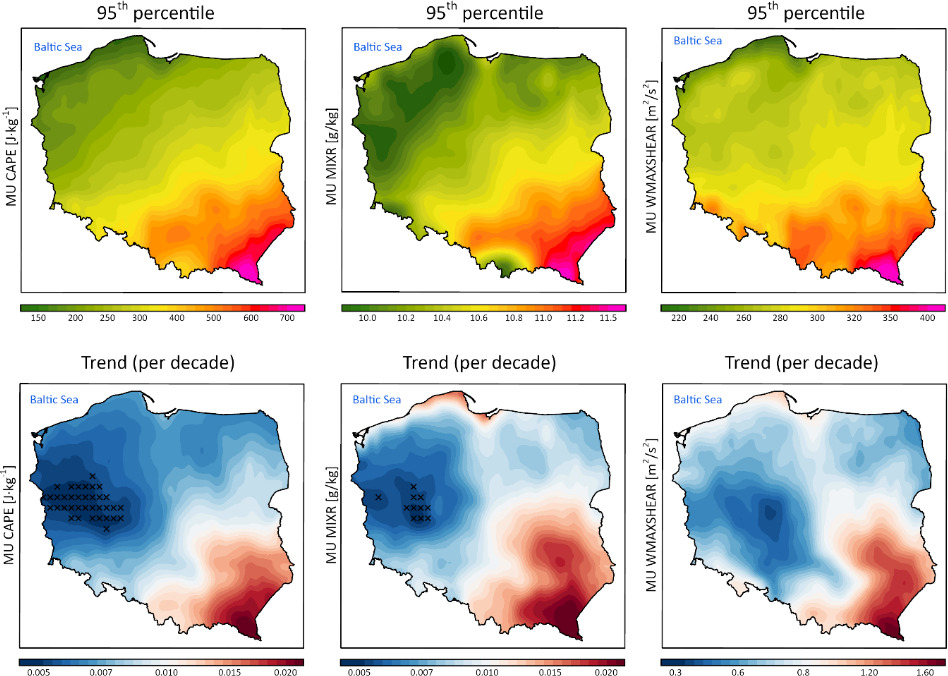
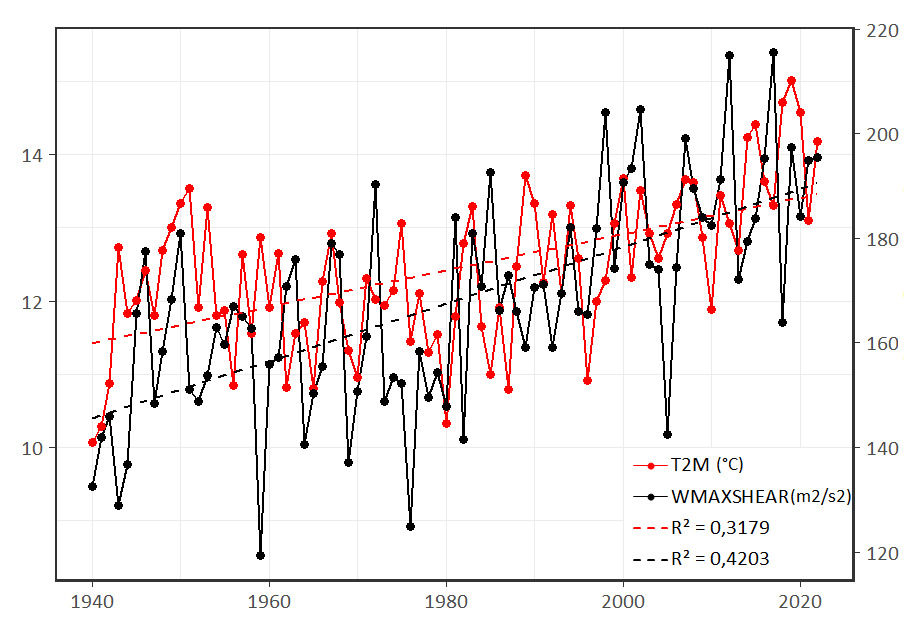
Fig. 15.
Time-course distribution of 2 m air temperature [T2M] and 0-6 km AGL wind shear with CAPE [WMAXSHEAR] for Poland. The dashed line indicates a trend for two factors.
As shown in the study by Taszarek et al. (2020), an increase in WMAXSHEAR indicator is also evident in northwestern Europe, which may be the reason for the shift in the jet stream due to the weakening thermal gradient between the mid-latitudes and the Arctic (Pena-Ortiz et al. 2013; Coumou et al. 2015). In addition, the climatology of the WMAXSHEAR factor for Europe clearly indicates that severe storms most often occur in summer in the corridor from northeastern Spain through parts of Central Europe, Italy or the Balkan Peninsula (Taszarek et al. 2020). In contrast, in spring, positive trends were recorded for most of Europe (including Poland), which confirms that favorable conditions for deep convection are also increasingly common in spring. These changes may be mainly due to an increase in convective potential energy and moisture using constant DLS values.
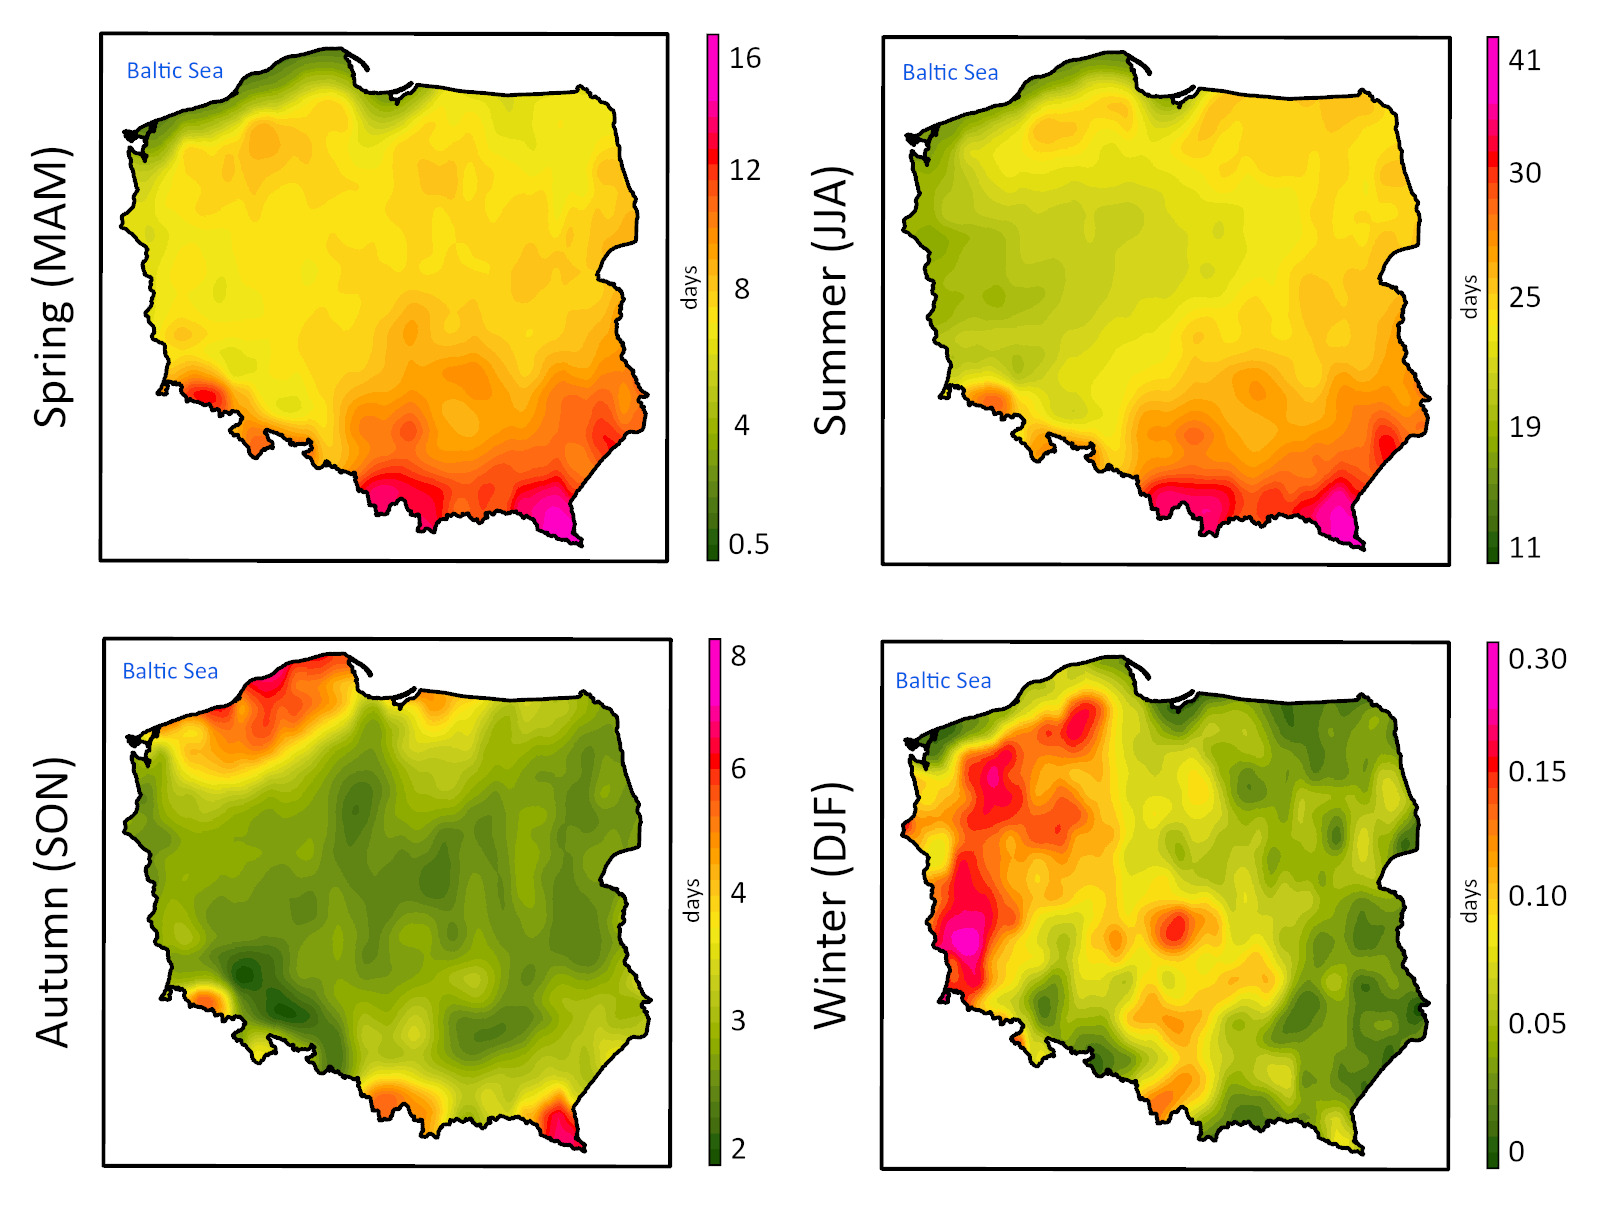
Knowing the convective and kinematic conditions, it was decided to simulate and reconstruct the number of days with thunderstorms for the period 1940-2022 based on ERA5 data (Fig. 16). The spatial distribution by season is very similar to the spatial distribution of the number of days with thunderstorms calculated using data from the PERUN lightning detection and localization system for 2002-2020. In summer and spring, the number of days with thunderstorms increases toward the southeast, while in autumn thunderstorms mainly occur in close proximity to the Baltic Sea. This is related to the increased temperature of the sea and the simultaneous possibility of convection over land (Sulik, Kejna 2023). In winter, the occur-rence of thunderstorms in Poland is local and is mainly associated with the western circulation, which provides an influx of unstable air masses from the north (Konarski et al. 2008). Winter is also a period when dangerous phenomena can be observed in thunderstorms formed as linear systems with embedded scour lines (Celiński-Mysław et al. 2020).
4. Discussion and final remarks
Each year, about 150 days with thunderstorms are recorded throughout Poland. Storm cells generate various amounts of lightning, and their number and spatial distribution are slightly different each year (Sulik 2022). From 2002-2020, the PERUN system detected and located more than 8 million CG flashes, which were used in this study. The intensity of generated flashes and their number associated with storm cells were necessary to reconstruct the convection environment in which CG flashes are generated. Data from ERA5 reanalysis were used for this task. As a result of the analysis of thermodynamic and kinematic conditions for the generation of CG lightning by cumulonimbus clouds in Poland, the following conclusions can be stated:
1) The average number of days with thunderstorms is about 30. The least number of days with a thunderstorm occurs in the northwest (10-15 days) and the most in the southeast (35-40).
2) Each year, there is an average of about 480,000 CG flashes.
3) 96% of all detected CG flashes have a negative current.
4) The highest electrical activity occurs in central Poland.
5) The highest number of thunderstorm days and electrical activity are in July.
6) From 2002-2020, there were 8 days with thunderstorms, during which the sum of CG flashes exceeded 50,000.
7) CG flashes are most common in WMAXSHEAR environments of ~500 m2/s2.
8) MU CAPE values in the range of 1,000 to 1,500 J/kg, combined with DLS in the vicinity of 13 m/s, are very favorable for the potential to generate CG flashes.
9) The chance of increased electrical activity increases when the air temperature is ~28°C, and the dew point is above 18°C.
10) The WMAXSHEAR parameter positively correlates with mixing ratio in the range of 12-14 g/kg
11) WMAXSHEAR correlates very well with HSI, which translates into increased generating of CG flashes.
12) A steady long-term increase in the WMAXSHEAR can be noted.
13) An additional positive aspect of the occurrence of elevated CG is supercells characterized by strong updraft speed, rotation, and the potential to precipitate large hail.
A detailed study covering the area of a country compared to the whole of Europe shows regional dependencies in the formation of CG on a local scale. Also noteworthy is the fact that forecasting hazardous weather phenomena such as severe wind gusts, torrential rainfall, or large hail is extremely important but is still quite challenging due to the changing climate. The tasks of forecasting and delineating areas at risk of hazardous weather events also include assessing the likelihood of lightning. Despite the continuous development of technology, warnings issued, and forecasts, there are still reports of people killed or injured by lightning, especially during the storm season, as evidenced by data from the ESWD database. Improving knowledge related to the environment in which CG flashes are formed will allow even more precise determination of the area at risk and greater protection of the population.