1. Introduction
In the era of an intensely changing climate, improving our understanding of weather phenomena, along with their reliable description using numerical models, is crucial. Numerical weather prediction (NWP) models are essential for supporting decision-making especially as global warming intensifies weather-derived natural hazards (Cornwall 2016; Herring 2018). Such extreme weather phenomena, including mesoscale convective systems (MCS), which can be organized into bow echo structures with mesoscale vortices, pose a particular risk of life-threatening and economic losses (EEA 2020). Emergency management and mitigation efforts related to such phenomena strongly rely on weather forecasts, which have seen intense progress in accuracy during the last 40 years (Bauer et al. 2015).
Among many factors, initial conditions were recognized to have tremendous implications on weather prediction accuracy, since even small initial differences between two NWP solutions will grow significantly over time (Lorenz 1963; Krishnamurthy 2019). Consequently, assessing the impact of initial conditions on forecast skill has become an important task in developing reliable weather predictions. Reichler and Roads (2003) pointed out that initial conditions have a significant impact on short-term forecasts, which are dominant in extreme weather predictions, when the model error itself is less powerful. Sutton et al. (2006) used the Weather Research and Forecasting (WRF) model and verified that in the case of a high-resolution grid (5 km), the initial conditions (related to soil moisture) were comparable to the differences resulting from adopting various convective parameterizations to the lower resolution grid (20 km). From the point of view of extreme weather event predictions, Jankov et al. (2007) conducted a detailed study on the influence of various physical schemes on the mesoscale convective system for rainfall forecasting. They found that WRF rainfall forecasts modelled with various treatments of convection, microphysical schemes, and planetary boundary layers are sensitive to the datasets used for model initialization. The impact of the initial conditions on the predictability of heavy rainfall was also investigated by Bei and Zhang (2007), who pointed out that the error related to small disturbances in initial conditions leads to significant uncertainties in a mesoscale forecast. Since global models are recognized as the best source of a real-time atmospheric state that can be used as initial conditions for short-term mesoscale forecasts, their uncertainties may also degrade the final NWP accuracy (Wei et al. 2010). As a consequence, the impact of these models on the mesoscale model forecasts was investigated by, among others, Kumar et al. (2015). Using the WRF model and four different global models, namely, the Integrated Forecast System (IFS), developed by the European Center for Medium-Range Weather Forecasts (ECMWF), the National Centers for Environmental Prediction (NCEP) Global Data Assimilation System (GDAS), the NCEP Global Forecasting System (GFS), and the National Center for Medium-Range Weather Forecasting (NCMRWF), they found that forecasts initialized using ECMWF/IFS produced the best solution for the Indian region. Some advantages from using IFS for the initialization of the WRF model were also found by Taszarek et al. (2019). Based on a derecho event, they found that, in contrast to the GFS, all IFS-based simulations correctly pointed out the possibility of extreme winds, although GFS-based simulations with a shorter lead time performed better for both the location and timing of extreme strong wind gusts (over 40 m•s-1).
In this study, we present the effects of using varied initial conditions on simulations of severe weather events. Our analysis focused on a derecho event that occurred in Poland on 11 August 2017, one of the most intense and devastating events in recent years (Widawski, Pilorz 2018). We were looking for answers as to which initial conditions would predict this phenomenon as accurately as possible. First, we provide information about the event. Second, we introduce the data and methodology, including a description of the WRF model domains and parameterization, information on all initial conditions tested, and the meteorological data used for quality evaluation. Next, we present results of the simulated meteorological parameters and validation using in situ ground measurements. Finally, we provide some conclusions and a discussion of the analysis.
2. Derecho in Poland, 11 August 2017
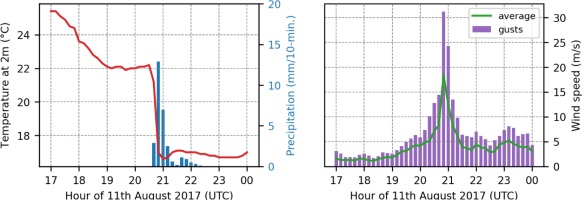
Although the derecho analyzed in this study occurred on 11 August 2017, the weather conditions that contributed to its creation started to develop a few days earlier. They were mainly related to the formulation and movements of two pressure systems, namely a long-wave trough over western Europe and a wide ridge that was situated over central and eastern Europe. The hot and dry subtropical air masses associated with the ridge were separated from the much more humid, westerly located polar air masses by a wavy cold front that stretched along the western border of Poland. On 10 August, a slight change in the orientation of the low-pressure system enhanced the meridian-directed flow of tropical air from the Mediterranean Basin over central Europe. This dynamic triggered a mesoscale convective system over the Czech territory, which during the night passed over the territory of Poland. The storms associated with the system contributed to increased cloudiness, which effectively reduced the insolation over southwestern Poland until afternoon. At the same time, the air masses over the eastern part of Poland were constantly heating under cloudless conditions, contributing to the creation of a strong thermal gradient. The convergence line between these two pressure systems was moving northward, under the influence of the mid-level jet stream, which led to the formulation of a distinct vertical wind shear. At about 1800 UTC the convective cells embedded in the northerly propagating bow echo that was constantly growing and finally evolved into a mesoscale convective vortex (MCV). The development and transformation of convective cells into MCV, and as a consequence into a derecho, was supported by the appearance of a rear inflow jet (Sulik, Kejna 2020). The thunderstorm reached its strongest form between 20:00 and 2100 UTC, when the echo structure was about 150 km long. At that time, at the Chojnice synoptic station, precipitation exceeded 13 mm•10 min-1 and was accompanied by a sharp drop in temperature (from 22.2 to 16.5°C) (Fig. 1, left). At the same time, the average wind speed exceeded 18.4 m•s-1 with a wind gust of up to 31.2 m•s-1 (Fig. 1, right). Very high wind gusts were also recorded at synoptic stations in Elblag (42 m•s-1), Chrzastowo (36 m•s-1), and Gniezno (35 m•s-1). At 2230 UTC, the convective system reached the coast of the Baltic Sea and began to weaken visibly. The synoptic situation was described in detail by Wrona et al. (2022).
3. Data and methodology
Here, we provide information on the WRF model used for simulations, together with domain characteristics, settings, and parameterization of physical processes. We also briefly introduce the initial conditions with some notes on their implementation in the WRF model. Lastly, we show meteorological data used for simulation verification: reflectivity and basic parameters from telemetry meteorological stations.
3.1. WRF model
We used the WRF model version 4.2.1 in nonhydrostatic mode, which has wide applications in atmospheric research and operational weather forecasting (Skamarock et al. 2019). Our version of the model was adapted to work on a high-powered Tryton computer at the Academic Computer Centre in Gdansk. For the simulation, 568 cores of the supercomputer were used, with 552 cores for the WRF model and 16 for I/O operations. This approach minimized the time it took to write the results by a factor of 10 compared to a standard run without I/O enabled.
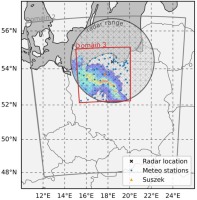
The derecho event was simulated using various initial and boundary conditions derived from the four global models: NCEP/GFS, ECMWF/IFS, GDAS, and ERA5. All models were provided with a time resolution of 3 hours. The spatial resolution of the GFS, GDAS, and ERA5 models is 0.25°. Therefore, in our simulations, we designed three nested domains in one direction with a nesting ratio of 5. Horizontal resolutions of domains, in Lambert conformal projection, were 12.5, 2.5, and 0.5 km. The time steps were 60, 12, and 3 seconds, respectively, for each domain. The time resolution was 1 hour for the outermost domain and 10 minutes for the other two. Because the spatial resolution of the IFS model is 0.125°, the first domain in our simulations was 7.5 km. The areas covered by these three domains were the same for all models. The first domain (domain 1) covers most of Europe, the second one (domain 2), the area of Poland, while the third one (domain 3 – with the highest resolution) covers the area where the bow echo and the greatest damage occurred. In Figure 2, the coverages of domains 2 and 3 are presented in detail. Vertically, simulations were done for 50 levels up to 50 hPa. Since the ERA5 model levels are provided on the model levels (137) and pressure levels (38), we performed calculations using both of them, called ERA5M and ERA5P, respectively.
For all simulations, the same parameterization of physics and model dynamics was used. We applied a single-moment microphysics scheme with six hydrometeor classes (WSM6) (Zaidi, Gisen 2018), which is the most suitable for high-resolution simulations (see, e.g., Hong et al. 2010; Parodi et al. 2019). For domain 1, parameterization of convective processes was performed using the Grell-Freitas method (Grell, Freitas 2014), while for domains 2 and 3, explicit wet process physics was used. Moreover, we applied short-wave and long-wave radiation parameterizations according to the RRTMG radiation propagation scheme, which is a new version of the RRTM (Iacono et al. 2008). The Mellor Yamada Nakanishi Niino (MYNN) turbulence scheme with closure 2.5 was used to model boundary layer processes (Nakanishi, Niino 2009). The near-surface layer was parameterized according to the MYNN scheme (Nakanishi, Niino 2006). To remove numerical noise at the start of the simulations, digital filter initialization (DFI) was used (Peckham et al. 2016). The land topography, land use, and soil type datasets were included in the model at the WRF preprocessing stage. For domains 1 and 2, the standard data contained in the WRF model geographic database (LULC) of IGBP MODIS and USGS GMTED2010 (30 arc seconds) were used. However, these data are insufficient for high-resolution simulations, as indicated by other studies (De Meij, Vinuesa 2014; Jiménez-Esteve et al. 2018; Siewert, Kroszczynki, 2020). Therefore, for domain 3 with a 0.5 km spatial step, we prepared new geographic data based on CORINE Land Cover (CLC) 2018 with 100 m and terrain topography from the Shuttle Radar Topography Mission (SRTM) with 30 m resolution. Siewert and Kroszczynski (2020) showed that CLC and SRTM data for microscale halves yield more accurate values for temperature and humidity at 2 m and wind at 10 m (speed and direction) compared to using default data from the WRF database.
In our analyses, we focused on the results derived from the innermost domain, which were stored with a 10-minute interval. Furthermore, we took into account initialized simulations at 0000 and 1200 UTC on 11 August 2017 to assess how the results depend on the starting time of the simulations.
3.2. Reflectivity data
In this study, the WRF reflectivity data were compared with data from the Meteor 1500C Doppler meteorological radar in Gdansk (Fig. 2, the black cross) included in the POLRAD network. This radar provides reflecitivity scans in the range of 250 km, with 10-min interval. Also, Doppler velocity scans are available in the range of 125 km, at a 6 min interval. Each scan contains 9 slices for different elevation angles: 0.5°, 1.4°, 2.4°, 3.4°, 5.3°, 7.7°, 10.6°, 14.1°, 18.5°, 23.8°. In the analysis, we used only reflectivity data after quality improvement using the RADVOL-QC system (Ośródka et al. 2014). In Figure 2 the radar range together with example maximum reflectivity extracted at 2000 UTC are presented.
Fig. 2.
WRF domain used in the study. The red rectangle represents a 500 m domain analyzed in this paper. The black cross shows the location of the meteorological radar in Gdansk (Poland) with a range equal to 250 km. The blue dots show the meteorological stations used for the validation of the results. The orange triangle identifies the location of Suszek, a village where the greatest damage was observed. In the background, the reflectivity derived from the meteorological radar in Gdansk is shown at 2000 UTC on 11 August 2017.
3.3. Meteorological observations
We used meteorological data from the basic measurement and observation network owned by the Institute of Meteorology and Water Management, National Research Institute. The meteorological situation on 11 August 2017 was represented based on data from 66 ground automated weather stations (AWS), located in the 52-55°N and 16-20°E domain, as shown in Figure 2 (blue dots). Data at 10-minute intervals of the following meteorological elements were analyzed: precipitation, air temperature, and wind speed, including wind gusts. Measurement data were subjected to the completeness verification procedure (looking for missing data caused by technical reasons) and data correctness (analysis of differences in time series for stations that had more than one data source). The most frequent sources of data gaps from AWS are data transfer, sensor malfunctioning, exceptional equipment maintenance, and unreasonable recorded data (Storch et al. 1999; Lompar et al. 2019).
For synoptic stations with series of hourly data made by meteorological observers, the data gaps from AWS were supplemented with data from an observer. In the case of missing data, which could not be filled with the simple interpolation between adjacent time series records (up to 30 minutes), the analyzed time series data were supplemented with data from at least three neighboring stations using triangulation or inverse distance weighting methods, commonly used in climatic research (Storch et al. 1999; Daly et al. 2000; Claridge, Chen 2006; Henn et al. 2013). When verifying the completeness and correctness of the measurement data, it was found that data deficiencies were less than 1% of all analyzed cases.
3.4. Simulation verification
To evaluate the quality of the simulated temperature and wind speed, we calculate the following statistical parameters:
• Bias or mean error (ME):
• Root mean square error (RMSE):
• Unbiased RMSE (uRMSE):
• Pearson correlation (R):
where Fi, Oi are the forecast and observed values, respectively, indexed with i; n means the total number of observations and σ denotes the standard deviation. ME is the mean difference between the forecasted and observed values, and therefore a valuable metric to present the tendency of the model to being over- or underestimated. On the other hand, averaging of positive and negative ME values may result in misinterpretation. RMSE or uRMSE is the square root of the squared forecast deviations and is used to mark better or worse simulations. We provide ME and R calculated for all time steps between 17:00 and 0000 UTC and present them as time series. These measures are also calculated for individual stations and presented on the map as scatter plots for hourly time steps. We utilize Taylor (Taylor 2001) and target (Jolliff et al. 2009) diagrams to show the relationship between statistical parameters and summarize model performance. The former is a polar coordinate diagram that assigns radial coordinates to the standard deviation and azimuth to the inverse cosine of the correlation coefficient (Eq. 4). The reference point (observation) is indicated for the polar coordinates (σO, 0). The model-to-observation distance is proportional to uRMSE (Eq. 3) and provides a measure of the model uncertainty. In the target diagram, uRMSE is assigned to the X-axis, and ME (Eq. 1) is assigned to the Y-axis. The distance between origin and the model versus observation statistics is equal to RMSE (Eq. 2). As uRMSE is always positive, Jolliff et al. (2009) proposed to utilize the positive region of the X-axis and multiply uRMSE by the sign of the standard deviation difference:
Verification of forecasts for precipitation and wind gusts is based on the contingency table (Table 1). For dichotomous forecast verification, the following quality measures were calculated:
• Probability of detection (POD):
• False alarm ratio (FAR):
• bias:
• Critical success index (CSI):
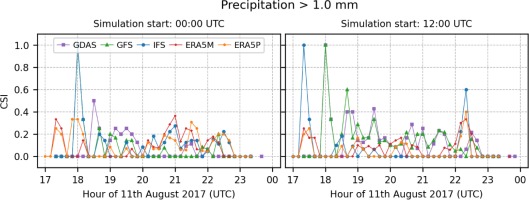
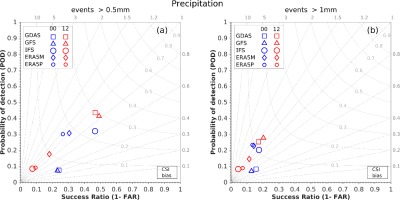
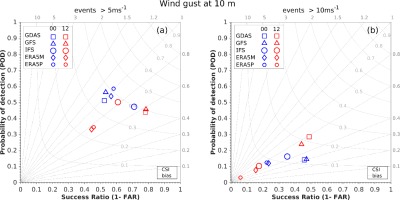
The POD, CSI (also known as threat score) is represented by the so-called success ratio (SR) which ranges from 0 (worst) to 1 (best). For FAR, SR = 1 − FAR. A bias score equal to 1 indicates an unbiased model. Higher or lower values indicate that the forecast is overestimated or underestimated, respectively. Analyzes were performed for selected levels. Values of 0.5 and 1.0 mm of accumulated precipitation were chosen over 10 minutes. For wind gusts, the values of 5 and 10 m•s-1 were chosen. The CSI are presented in the same manner as for temperature and wind speed. The performance of individual models is summarized by means of a diagram introduced by Roebber (2009).
The Roebber performance diagram is utilized to summarize the dichotomous verification of precipitation and wind gust. With simple algebraic manipulations, one can relate CSI and bias to SR and POD:
If SR and POD are assigned to the X- and Y-axes, respectively, then isolines of bias and CSI can be drawn on a figure. A perfect forecast should be located on the upper right of the diagram.
Reflectivity was verified using maximum reflectivity fields derived from meteorological radar. To access which model gives more reliable results, we used the index of agreement proposed by Willmott and Wicks (1980) and Willmott (1981). This index is a dimensionless measurement of the accuracy of the model and is used in several meteorological and hydrological studies. We used a modified version of this index (dmod) proposed by Willmott (1984), which may be regarded as a more rigorous method than the original version (Pereira et al. 2018). As shown by Willmott et al. (2012), dmod reaches its maximum value more slowly as the predicted values approach the observed values. The modified Willmott index is described by the following formula:
dmod is bounded by 0 and 1: no agreement and a perfect fit, respectively.
4. Results
This section describes the results of the simulations, as well as their verification based on in situ measurements. We divided this section into subsections by meteorological parameters: temperature, wind speed, precipitation, wind gusts, and reflectivity. Some visualizations of the results are included in the Appendix. The analysis of temperature and wind speed is divided into two stages. In the first, model errors are analyzed in subsequent time steps, and in the second, at the location of each station. Results are presented separately for simulations initialized at 00:00 and 1200 UTC. Evaluation of precipitation and wind gusts is based on dichotomous verification for two exceedance levels. The range and spatial distribution of CSI are presented. For reflectivity, the range of the Willmott index is shown.
4.1. Temperature
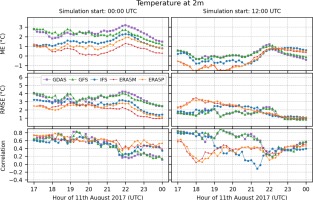
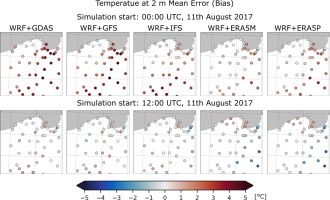
In general, the predicted temperatures for 0000 UTC were noticeably higher than those obtained from the simulation at 1200 UTC. It is clearly seen in Figure 3 where ME, RMSE and the correlation of the temperature at 2 m between all simulations and in situ measurements are shown. For all calculations initialized at 0000 UTC, the temperature is overestimated. The largest ME are observed for GDAS-driven simulations with a maximum of 3°C at 2200 UTC. ME for runs initialized at 1200 UTC, in turn, are in the range of –1.5 to 1.5, except for ERA5-driven simulations that exceed –1°C. The most accurate results were obtained for simulations driven by GDAS and GFS. ME are slightly fluctuating for all runs until 2100 UTC, then the errors approach maximum values and decrease after 2200 UTC. The RMSE series for 1200 UTC runs follows the ME behavior. The highest values were found for GDAS and GFS with a maximum > 4°C at about 2200 UTC. Following the coldest bias, ERA5-driven simulations initialized at 1200 UTC show the highest RMSE values with a peak at 1800 UTC. After 2200 UTC, the RMSE is visibly decreasing for all results. Correlation values calculated for every time step can be interpreted as quasi-spatial correlation of observation and model fields, except that the data are non-uniformly gridded. The correlation values for the 0000 UTC models are very close and quite high (0.5-0.8) until 2000 UTC when the R values decrease and clearly differ between models; the highest are for the ERA5 models (0.5-0.6) and the lowest for GDAS and GFS (0.2). For models initialized at 1200 UTC, the correlations are quite high for GDAS and GFS until 2100 and for IFS until 1900 UTC. Then, the R values decrease rapidly for the latter model. The correlations for the ERA5 models are the smallest, except for the period between 1900 and 2200 UTC where the IFS is the least correlated. The R values of all calculations initialized at 1200 UTC behave similarly and increase slightly from 0.1-0.4 at 22 UTC to 0.4-0.6 at the end of the simulations.
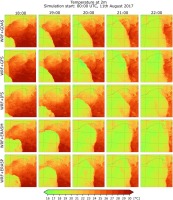
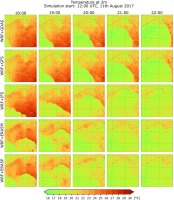
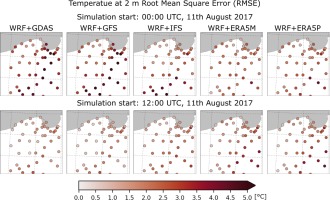
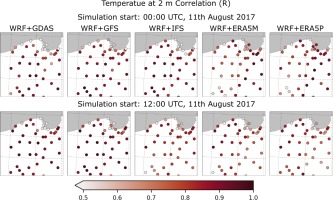
More details about simulation differences are given in Figures A1 and A2 (Appendix), where selected temperature distribution maps between 0000 and 1200 UTC are shown. Among all results, those based on the ERA5 model stand out, mainly due to the differences in temperature between the 0000 and 1200 UTC simulations. Also, ME values for 0000 UTC GDAS- and GFS-driven WRF simulations are the highest for most of the stations (Fig. A3). The lowest values are found in the western part of the domain. The ME values for the IFS model are highest in the southern part and lowest in the northern part. The mean errors for the ERA5-driven simulations are the highest in the eastern part and the lowest in the western part of the domain. The ME values for the 1200 UTC models are quite similar in all domains except for the simulations driven by IFS and ERA5, which exhibit negative values in the eastern region. The RMSE (Fig. A4) are the largest for GDAS- and GFS- driven WRF calculations initialized at 0000 UTC, with maximum values in the eastern region, much like ERA5 driven runs initialized at 1200 UTC. The lowest RMSE are seen for GDAS and GFS from 1200 UTC. The correlation (Fig. A5) is > 0.5 in all domains for all results, with the lowest value for the station located on the Baltic coast.
4.2. Wind speed at 10 m
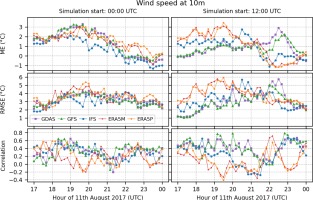
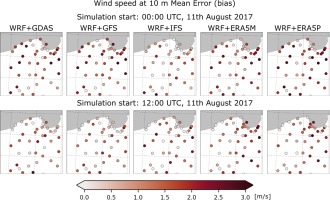
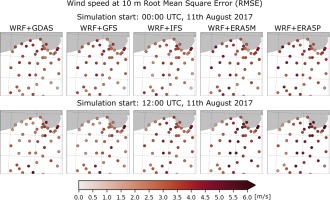
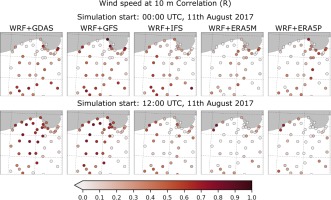
As in the case of temperature, the difference in wind speed was obtained for various initial conditions and the initialization of the simulation time. The mean error of the wind speed (Fig. 4) predicted from 0000 UTC increases to a maximum value of 2-3 m•s-1 at 1920 UTC and then decreases to negative values for all models except ERA5P. The lowest ME values are found until 2100 UTC for the GDAS and GFS predictions initialized at noon. The values increase slightly from 0 to 1 m•s-1 at 2100 UTC. After this time, the ME for GDAS and GFS is rapidly increasing to 3 m•s-1 and 2 m•s-1, respectively, and decreasing to the (–1, 0) range for other models. Maximum RMSE values are found at 2000 UTC, the largest for ERA5 driven simulations. The discrepancy for predictions initialized at 1200 UTC is much greater. The RMSE for ERA5 driven calculations exceeds 3 m•s-1. Spatial correlations do not exceed 0.6 and decrease to –0.2. Positive correlation for the entire series is only found for IFS initialized at 0000 UTC and GDAS and GFS started at 1200 UTC. The results for the subsequent initialization time are more variable.
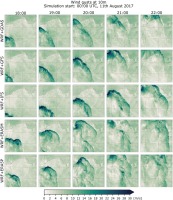
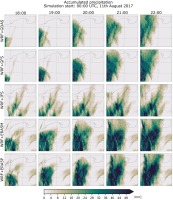
Detailed differences in the spatial distribution of the winds and their speed, obtained by adopting various initial conditions, can be observed in Figures A6 and A7, where wind gusts at 10 m between 1800 and 2200 UTC are presented. The spatial distribution of ME (Fig. A8) and RMSE (Fig. A9) is very variable and does not reveal any special pattern, unlike in the case of correlation (Fig. A10). Stations with high temporal correlations are found in the western and southern part of the GDAS and GFS WRF predictions initialized at 0000 UTC. The simulations of these models also have high R values for most locations except the southern region.
4.3. Precipitation
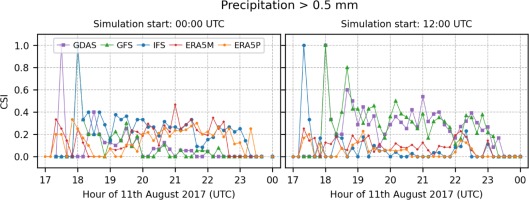
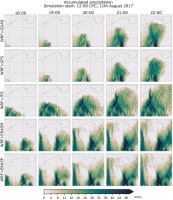
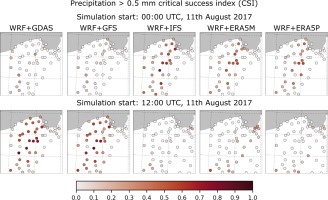
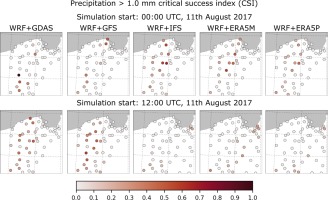
CSI values for events with precipitation sum > 0.5 mm•10 min-1 (Fig. 5) are lower than 0.4 except for 2 cases for GDAS-driven simulations initialized at 0000 UTC. The cases are related to isolated precipitation events that appear from the southwestern direction (Fig. A11). Similar events are seen for the initialized predictions for IFS and ERA5P at 1200 UTC (Fig. A12). The CSI for runs initialized at 1200 UTC has larger values than those initialized at midnight (Fig. 6). Precipitation events of 1 mm•10 min-1 and greater have slightly lower predictability.
The spatial distributions of the CSI values for precipitation events > 0.5 and 1 mm•min-1 are presented in Figures A13 and A14, respectively. The former events are slightly more predictable for IFS- and ERA5-driven simulations initialized at 0000 UTC. On the other hand, GDAS and GFS play the primary role among other models initialized at 1200 UTC. Events > 1 mm•10 min-1 have worse predictability at particular locations.
4.4. Wind gusts
During the subject derecho event, wind gusts were the most dangerous and caused numerous property losses. In this study, the simulated values differ significantly between each case. The largest damages were reported in the vicinity of the synoptic station in Chojnice. The maximum observed wind velocity from meteorological sensors at this station was 31.2 m•s-1 at 2050 UTC. In general, all simulations significantly underestimated the maximum wind gust. The calculation based on the ERA5M and ERA5P model initialized at 0000 UTC was close to the actual value amounting to approximately 19.5 m•s-1. However, the simulated time of the maximum gusts was earlier than the actual time, 1830 and 1930 UTC, respectively. Simulations based on IFS (at 0000 UTC) and GDAS (at 0000 and 1200 UTC) were nearest in time to the occurrence of the phenomenon, taking place at 2040, 2020, and 2040 UTC, respectively. However, the predicted values were also underestimated: 15.6, 15.5, and 18.1 m•s-1, respectively.
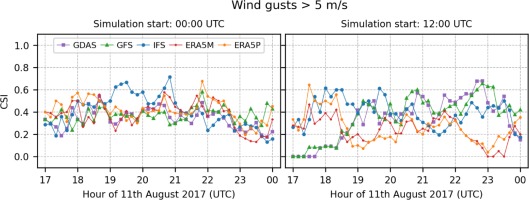
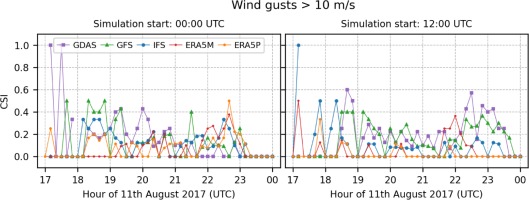
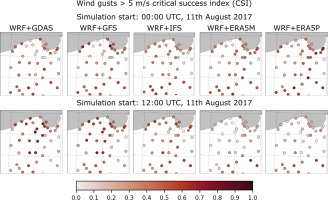
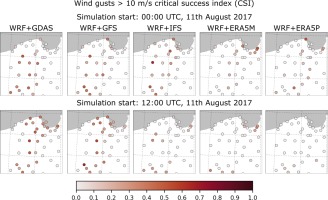
In Figure 7, the CSI series for wind gusts > 5 m•s-1 are presented for models initialized at 0000 UTC. It is seen that the obtained values differ between the models. Only the GDAS model has slightly better performance between 1900 and 2100 UTC for that exceedance level. Predictions initialized at 1200 UTC have lower predictability (Fig. 8), slightly more than 0.6, but touching the lowest possible level in some periods (GDA, GFS, and ERA5M). The CSI values vary much more than for predictions initialized at 0000 UTC. CSI for wind gusts > 10 m•s-1 is much smaller and varies greatly over time.
The high predictability of wind gust events >5 m•s-1 (Fig. A15) is found for about half of the stations and simulations initialized at 0000 UTC. This is also the case for predictions driven by GDAS, GFS, and IFS initialized at 1200 UTC. Single locations are found to be more predictable in the southern part of the domain for the ERA5-driven computation of the 1200 UTC initialization time. For the 10 m•s-1 exceedance level, higher CSI values (Fig. A16) are found for only a few stations and mainly for predictions driven by GDAS and GFS for both initialization times. Some single stations with higher CSI are also found for the IFS prediction initialized at 0000 UTC.
4.5. Reflectivity
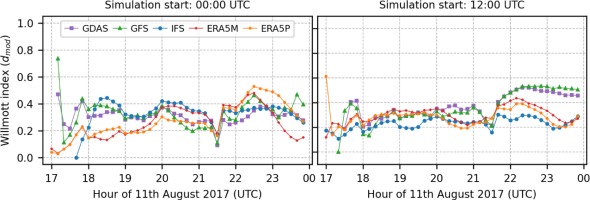
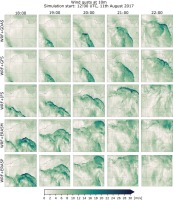
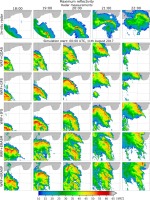
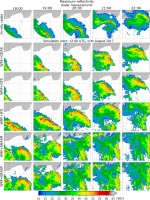
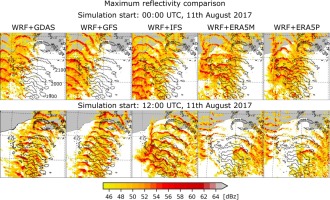
The temporal evolution of the maximum reflectivity field for values higher than 45 dBZ with 30-min steps is presented in Figure 9 against measured values. The simulation of maximum reflectivity is presented with 1-h steps in Figures A17 and A18 for initialized runs of 0000 UTC and 1200 UTC, respectively. It is clear (Fig. 9) that the modelled track of the convective line match was observed one only for GDAS and GFS predictions initialized at 1200 UTC. On the other hand, the shape and location of the thunderstorm are different from the observed one. Also, the modelled structure is not as sharp as detected by the radar. It has also been found that, in general, maximum reflectivity fields were simulated more westward for models initialized at 0000 UTC than at 1200 UTC. This is in line with the results shown by Taszarek et al. (2019). This visual inspection is reflected in the Willmott index (Fig. 10). All models, except GDAS and GFS started at 0000 UTC, and IFS started at 1200 UTC are in advance of event. Afterward, the index is slightly increasing to about 0.4 at 2000 UTC. Thereafter, the values reduce to about 0.2 at about 2130 UTC and increase to about 0.5 afterward, mostly for GDAS and GFS runs initialized at 1200 UTC.
Fig. 9.
Maximum reflectivity derived from the WRF model with various initial conditions and from meteorological radar. Data presented for hours between 1830 and 2300 UTC in 30-minute intervals. The black outlines represent the measured values. Reflectivity was plotted only for values higher than 45 dBz.
4.6. Summary of the evaluation of statistical models
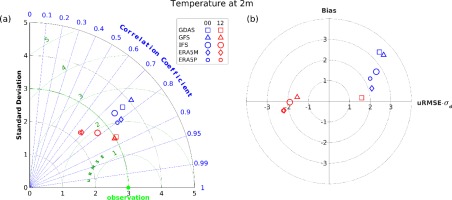
The Taylor diagram for temperature (Fig. 11, left panel) shows that simulations of GDAS and GFS initialized at 1200 UTC performed best. The correlations are the highest, close to 0.9, and uRMSE is the lowest and closest to the observed value. It is also found that predictions initialized at 0000 UTC (indicated by blue markers) have larger deviations and those initialized at 1200 UTC (red marker) had smaller deviations or were nearly equal to the observed values. This pattern also can be seen in the target diagram (Fig. 11, right panel), where blue markers are placed in the positive region of the X axis, and red markers (except for GDAS with slightly larger σF than σO) are placed in the negative region. The mean errors are the lowest for 1200 UTC initialized runs and the largest for 0000 UTC runs that are warm-biased. According to the above diagrams, the ERA5 computations started at 0000 UTC seem to be the second best performing predictions.
Fig. 11.
Taylor (left) and target (right) diagrams showing model-to-observation statistics for temperature at 2 m.
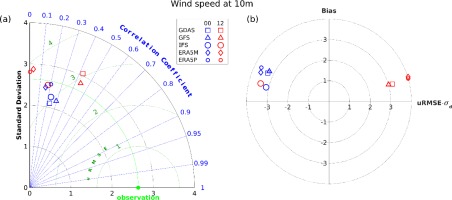
The Taylor diagram for wind speed at 10 m (Fig. 12, left panel) shows the best performance of the GDAS and GFS simulations for both initialization times and the IFS initialized at 0000 UTC, but the skill is very low. uRMSE is about 3 m•s-1. The performance is the lowest for ERA5 predictions initialized at 1200 UTC with a correlation close to zero. All models are positively biased (Fig. 12, right panel) and the lowest mean errors are found for GDAS, GFS and GFS runs initialized at 1200 UTC and IFS initialized at 0000 UTC. The ME values differ slightly between models.
Fig. 12.
Taylor (left) and target (right) diagrams showing model-to-observation statistics for wind speed at 10 m.
In Figure 13, Roebber’s performance diagram is presented for precipitation events > 0.5 mm (left panel) and 1 mm (right panel) per 10-minutes. According to Fig. this figure, the best skill was found for the GDAS and GFS models initialized at 1200 UTC, but the POD and SR values do not exceed 0.5 and 0.3 for events > 0.5 and 1 mm•10 min-1 respectively. Unlike these models, which are initialized at 0000 UTC, they suffer from very low prediction skills. The same applies to IFS and ERA5 runs initialized at 1200 UTC.
The performance diagrams for wind gust events are presented in Figure 14. All models, except ERA5 initialized at 1200 UTC, are located near CSI = 0.4 isoline for weaker wind gust events, but GDAS and GFS have the lowest false alarm ratio. Stronger wind gust event predictions are worse, with the highest skill provided by the GDAS and GFS simulations initialized at 1200 UTC. The least skill is found for ERA5 predictions initialized at 1200 UTC and for both events.
5. Conclusions and discussion
In this paper, we present a detailed verification of various WRF simulations that differ in initial and boundary conditions. As a case study, we chose the derecho event of 11 August 2017 that, was one of the most intense and devastating hazardous phenomena in recent years in Poland. We performed high-temporal (10 minute) and spatial resolution (0.5 km for the third domain) simulations with initialization at 0000 and 1200 UTC. As boundary and initial conditions, we used a suite of global models. The bow echo feature was clearly seen in GFS- and IFS-based simulations initialized at both times, and GDAS initialized at 1200 UTC. Simulations performed using ERA5 data produce maximum reflectivity fields that are very different from those observed. The characteristic bow echo structure was visible in ERA5 simulations started at 0000 UTC, but the MCS was evolving too fast and only in the western part of the domain. The observed event was also reconstructed by other simulations initialized at that time. Simulations based on ERA5 at 1200 UTC show the field scattered throughout the domain. The closest to observed evolution of the bow echo structure was obtained from the results of GFS- and GDAS-based simulations started at a later initialization time. The results of all simulations were evaluated against surface observational and radar data. The best skill was found for GFS- and GDAS-driven simulations and shorter lead times. For the same time, ERA5-based results were characterized by the worst predictions. Middle-ranking IFS-driven runs show a similar dependence on lead time. This finding can be confirmed by the daily cycle for the RMSE signal found by Ylinen et al. (2020) for the temperature forecasts of the IFS ensemble prediction system for Europe. Goutham et al. (2021) found a similar correlation for the surface wind but a smaller RMSE for the IFS model. For the 0000 UTC initialization, all models predicted a more westward phenomenon than the actual case. The 1200 UTC simulations look better in this respect, which was also found by Taszarek et al. (2019). Although the GDAS and GFS models were the best predictors of the location of the derecho, all models were characterized by a low probability of detection and a high number of false alarms forecasting extreme precipitation and wind gusts. The study by Gevorgyan (2018) also shows that exact prediction of extreme convective events is a hard challenge and WRF simulations are very sensitive to chosen microphysics and forcing data.
Data availability
Data from all simulations, in NetCDF format, are available on The Bridge of Knowledge platform of Gdansk University of Technology under the CC BY-NC-SA license (Figurski, Nykiel 2020a, b, c, d, e).

