1. Introduction
On August 11, 2017, roughly at 20:30 UTC, a very strong storm passed over the Polish voivodeships of Kujawsko-Pomorskie and Pomorskie, the effects of which are still being analyzed. Six people died, and two were residing at the scout camp in Suszek. Many people were also injured as a result of being hit by broken trees. More detailed information about the consequences of this event may be found in Chmielewski et al. (2020).
As reported from synoptic weather forecasts and synoptic surface maps published by the Polish Institute of Meteorology and Water Management, National Research Institute (IMGW-PIB), on August 11 at 00:00 UTC, northwestern and western Poland were under the influence of a warm, wavy-shaped atmospheric front (Sulik, Kejna 2020). During the day it changed its location slightly and moved to the northern part of the country. The rest of Poland was under the influence of the low-pressure system. The situation remained roughly unchanged throughout the day. The western part of the country was within the range of the cold atmospheric front. The center of the shallow low-pressure system was in western Germany. In the evening, the western provinces were under the influence of an occluded front. The southern regions were within reach of the cold front, and the eastern ones were under the influence of the warm front.
On that day, as measured at synoptic stations in northern Poland, the temperature first increased to >20ºC (Toruń 26.7, Szczecinek 23.2, Elbląg 23.9, Chojnice 23.6) at 18:00 UTC. Then, after the passage of the storm, the temperature dropped sharply to 17-18ºC (respectively, Toruń 18.6, Szczecinek 17.8, Elbląg 17.4, Chojnice 16.5) at 22:00 UTC, and remained practically unchanged for the rest of the day. A maximum wind gust of 42 m/s was recorded at the synoptic station in Elbląg (about 115 km northeast of Suszek).
The probability of occurrence of the unstable (convective) situation was confirmed by the radio-sounding analysis, in particular, the atmospheric sounding diagrams at 12:00 UTC from Legionowo, Wrocław, Łeba, Greifswald, and Prostejov sounding stations (Table 1, Figure 1). All the data from sounding stations were collected in the archives of the University of Wyoming1.
Table 1.
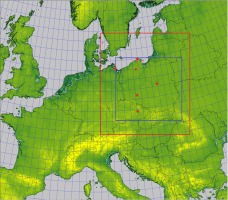
Locations of SYNOP (black) and upper air (red) stations, common for domains in all model resolutions.
Fig. 1.
Basic computational domain of the COSMO model with a resolution of 7 km × 7 km, 385×321 grid points (red square indicates the nested domain 2.8 km × 2.8 km, 380×405 grid points, blue = nested domain 0.7 km × 0.7 km, 1140×1020 grid points). The big red diamond indicates the location of Suszek (53.72N, 17.76E), small red squares are locations of SYNOP stations as listed in Table 1; red stars are upper air sounding stations as listed in Table 1.
For example, the difference between Lifting Condensation Level (LCL) and the Level of Free Convection (LFC) levels from the sounding in Legionowo was rather small, less than 100 hPa, which may have favored the development of convective phenomena.
Other soundings from Łeba, Wrocław, and Greifswald also indicated the occurrence of strong wind shear in the lower troposphere and high wind velocities. In Łeba and Wrocław, there were rapid changes in wind speed and direction in the lower troposphere. In Greifswald, the wind direction in the lower troposphere changed from 60 degrees at 12 m altitude to 200 degrees at an altitude of approximately 3 km asl. The difference between LCL and LFC (969 hPa and 955 hPa, respectively) was quite small, indicating the possibility of intensive convective phenomena, which favor the formation and development of storms. Moreover, most of the values of basic convective indices like the Lifted Index, Total Totals Index, or Showalter Index from the soundings suggested a very unstable atmosphere with the possibility of the occurrence of dangerous phenomena such as storms, supercells, and, eventually, tornadoes (University of Wyoming Webpage, see also Sulik, Kejna 2020). An overlap of strong vertical wind shear and these kinds of instabilities can support organized convective modes such as supercells and squall lines (Thompson et al. 2012). A detailed description of the genesis of this particular event was presented by Taszarek et al. (2019).
This paper presents an analysis aimed at answering the question of how the COSMO2 numerical model running at different resolutions predicted the occurrence and features of the mesoscale convective system of August 11, 2017. Another equally important issue to analyze was to what extent increasing the resolution and, consequently, the extension of the computation time, improved numerical forecasts, especially the forecasts of intense convective phenomena.
Previous studies on the effect of resolution enhancement on convection parameterization found that the sensitivity of parameterized convection and large-scale precipitation to resolution results from an increase in the value of vertical velocities (Herrington, Reed 2017, 2020). However, the improvement of forecasts, especially forecasts considering strong convective phenomena with the increase in resolution, was not so obvious. It has been found (Potvin, Flora 2015; Sun et al. 2021) that increasing the horizontal resolution does not necessarily improve the description of convection, and for operational purposes related to storm forecasts and warnings, the 2-3 km grid spacing seemed to be sufficient.
We do not attempt to explain the causes of intense convective phenomena at kilometer and sub-kilometer scales. The aim of this research is to determine to what extent models with finer resolution can be used in synoptic practice. An additional question was whether it is worth using such models to support decisions on warnings, even at the cost of a significant increase in calculation time.
The genesis, course, and effects of such events showed that the development of appropriate tools to predict and estimate the intensity of such phenomena could be very important.
2. Methodology
In this work, the authors used numerical forecasts in nested domains with the COSMO model working successively at grid spacings of 7 km, 2.8 km, and 0.7 km. The nested domains in the cascade are shown in Figure 1, along with the marked location of Suszek, SYNOP stations, and sounding stations. The input data and initial/boundary conditions (IC/BC) for the model with horizontal grid spacing equal to 7 km were obtained using the results of the global ICOsahedral Non-hydrostatic model (ICON; Zängl et al. 2015). ICON’s native grid resolution is 13 km. In the vertical, the model defines 90 atmospheric levels up to the maximum altitude of 75 km. In the sequence of calculations, the results of the COSMO model in 7 km resolution were used as IC/BC for calculations in 2.8 km resolution, which in turn were the source of IC/BC for calculations at 700 m resolution. In addition, an important difference in the description of convection processes at different resolutions was the use of the deep convection scheme at a resolution of 7 km and the shallow convection scheme (2.8 km, 0.7 km), both based on Tiedtke’s scheme (Tiedtke 1989). All the parameterizations included in the COSMO model were described in its documentation (see COSMO webpage in references, model version 2018). Brief information on model settings is as follows (see also Duniec et al. 2017 for operational setup):
model version 5.05, February 2018;
non-hydrostatic core;
40 vertical levels (in all resolutions);
model maximum altitude 22 km;
time horizon of forecast 24 hours;
time steps 40, 15, and 5 seconds for 7, 2.8, and 0.7 km, respectively;
At each resolution, forecasts of the fields of the following meteorological elements and indicators were calculated:
Supercell Detection Index (SDI1/SDI2; Baldauf, Seifert 2008);
Maximum windspeed at 10 m above ground level (VMAX at 10 m agl., COSMO webpage);
Radar reflectivity (see below);
Storm Relative Helicity 0-3 km (SRH; Markowski et al. 1998);
Vertical component of vorticity (Dahl et al. 2014).
Of the above quantities, VMAX, and reflectivity (un-attenuated, in Rayleigh approximation) values were obtained as Direct Model Output (DMO, COSMO webpage for documentation), while the others were derived as a result of post-processing of standard model results (wind speed and direction, atmospheric pressure, temperature, etc.). In turn, reflectivity observation data were available as HDF5 files in spatial resolution of 1 km, i.e., approximately 0.008 degrees (latitude) × 0.01 degrees (longitude at 50°N). The observed reflectivity values have been transferred to a common grid. Namely, for comparison and verification, the observational reflectivity data have been transferred to the 7 km grid (considered the basic one) along with the corresponding data from the forecasts in resolutions of 2.8 and 0.7 km (and, of course, at 7 km).
Due to the large volume of the material, other convection-related quantities and parameters, although computed, were not included in this work.
At each specified resolution, numerical forecasts for a specific date could be obtained by selecting the starting moment and a sufficiently long forecast time horizon. Thus, if one set the starting point of the forecast, for example, on August 10, 2017, at 00:00 UTC, the time horizon should not be shorter than 48 hours (until 00:00 UTC, August 12, 2017). By shifting the starting point forward with a time step of six hours, it would be possible to shorten the length of the forecast by an appropriate period. The “latest” runs might start at 18:00 UTC on August 11, 2017, with a corresponding forecast horizon of six hours. This procedure resulted in a set of eight increasingly shorter forecasts, each of which could provide information on the state of the atmosphere during the period of interest, i.e., between 20:00 and 21:00 UTC on August 11, 2017. However, the results of these subsequent forecasts were inconsistent in the sense that they changed along with the change in the starting point of the model. For this reason, the authors limited the entire analysis to three 24-hour runs of the model at all resolutions, starting at 00:00 and ending at 12:00 UTC.
The calculation results (forecasts) changed as the result of two factors. First, there were successive changes to the initial conditions (the closer to the date in question, the newer initial data could be used, from which a supposedly more accurate forecast could be generated). Second, there was a shorter time interval between the spin-up of the model (see e.g. Bonekamp et al. 2018) and the occurrence of the phenomenon under consideration. Therefore, a balance had to be established between the influence of these two elements to assess which of the two factors influenced the results more significantly and positively.
3. Results and discussion
It should be emphasized that in addition to the studies presented below, concerning issues and quantities related to convection, the authors also assessed the quality of forecasts of the atmosphere's state in terms of basic parameters, such as temperature at 2 m agl or wind speed at 10 m agl, as measured at synoptic stations.
The latter quantities may be the subject of separate work, but in this study, they only provide arguments about the quality of the model results at the specified resolutions, because they do not define either the nature or the intensity of convective phenomena, the main subjects of this study. In general, every model run that extended from 00:00 UTC to 12:00 UTC gave a similar quality forecast and did not differ significantly at practically all resolutions, except maybe for the 0.7 km resolution run at 12:00 UTC.
The key issue here is, however, that the comparison of forecasts and actual images of radar reflectivity (resolution of 1km, POLRAD network; Łuszczewski, Tuszyńska 2022) showed that the earlier runs, from 00:00 UTC until 06:00 UTC on August 11, predicted the beginning and development of the phenomenon too west, compared to observations (Figures 2a-c). This conclusion agrees with other studies (Taszarek et al. 2019). One exception is the forecasts with a resolution of 2.8 km at 06:00 UTC. In this situation, according to forecasts, the phenomenon started too far west, but the speed of the system's movement was so great (in fact, greater than reality and much greater than, for example, the launch of the model at 12:00 UTC) that it reached the Bay of Gdańsk sooner than in the actual situation. This example is presented in Figure 2b, with the time stamps added to observations and this particular forecast.
Fig. 2a.
Reflectivity, maximum hourly values. Left to right: the actual reflectivity image (POLRAD network); reflectivity forecasts at 7 km resolution, model runs starting at 00:00, 06:00, and 12:00 UTC, August 11, 2017. Time markers added for the forecast started at 06:00 (see explanations in text).
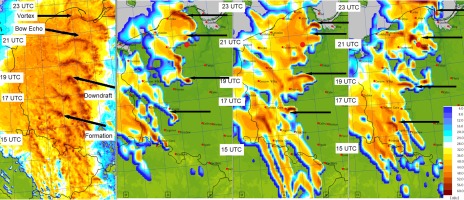
Fig. 2b.
Reflectivity, maximum hourly values. Left to right: the actual reflectivity image (POLRAD network); reflectivity forecasts at 2.8 km resolution, model runs starting at 00:00, 06:00, and 12:00 UTC, August 11, 2017.
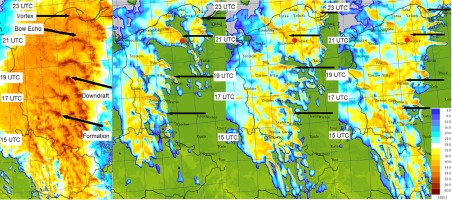
Fig. 2c.
Reflectivity, maximum hourly values. Left to right: the actual reflectivity image (POLRAD network); reflectivity forecasts at 0.7 km resolution, model runs starting at 00:00, 06:00, and 12:00 UTC, August 11, 2017.
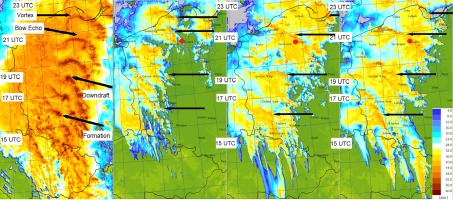
In Figure(s) 2 (left panes, the actual radar images) it can be seen that the bow echo (for detailed information about structures of this kind see Celiński-Mysław et al. 2020 or Surowiecki, Taszarek 2020) formation started at around 17:00 UTC, which is shown with the southernmost arrow (labeled as “Formation”). This and subsequent (from the bottom to the top of the Figure) arrows in charts of reflectivity forecasts correspond to the areas and structures identified in the study of Taszarek et al. (2019), and labeled as “Downdraft”, “Bow Echo” and “Vortex”. However, this recognition and comparison were made only qualitatively (through the visual similarity of the images of subsequent structures) rather than quantitatively, via direct reflectivity values. A similar procedure, i.e., qualitative recognition of structures identified in the actual radar area, was used for Figure 5.
Fig. 3.
Reflectivity (radar image, source: IMWM-PIB; top panel) and the forecast of the radar image based on the model results in resolutions (top to bottom) 7.0 km, 2.8 km, 0.7 km, from 18:00, 20:00 and 22:00 UTC (left to right). Model run start 00:00 UTC. See explanations in the text.
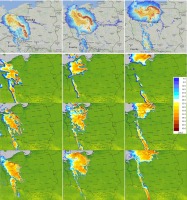
Fig. 4.
Reflectivity, observations vs. forecasts. Top to bottom: Mean Absolute Error, Root Mean Square Error, Pearson’s correlation coefficient for resolution 0.7 (red line), 2.8 (green line), and 7.0 km (blue line). The results of the forecast run started at 12:00 UTC.
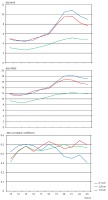
Fig. 5.
Maximum reflectivity with 1 h step. Left to right: image from the POLRAD network; forecasts based on the model results at resolution 0.7km, 2.8 km, and 7.0 km from 12:00 to 22:00 UTC. The arrows indicate the structures identified in the actual radar image and the corresponding areas obtained from the reflectivity forecasts. Formation = suggested location of formation of supercell; Downdraft = rear flank downdraft, strong outflow; Bow Echo= structure of bow echo accompanied with rear inflow; Vortex = convective vortex.
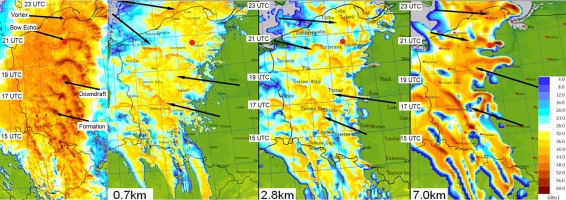
Figure 3 shows a comparison of the radar reflectivity (from 18:00 to 22:00 UTC in 2-hour intervals) with the forecasts of the radar image at three model resolutions. The comparisons are rendered strict and quantitative by assessing compliance with the observations (POLRAD network) of the model results using MAE, RMSE, and Pearson correlation coefficients calculated for the common area of all three model domains, i.e., the entire model domain with a resolution of 0.7 km (see Figure 1).
The values of the model forecasts for maximum reflectivity, based on the forecasts that started at 6:00 and 12:00 UTC with a resolution of 7 km, agree well with the actual values (see e.g., Figure 2a). The areas of maximum reflectivity occur at a certain distance from the location of the scout camp in Suszek. The maximum reflectivity is best represented by the forecast starting at 12:00 UTC, but also in this case the maximum values are shifted to the southeast and northwest of Suszek. In the model started at 00:00 UTC, the predicted peak reflectivity is shifted to the north. Similar maximum reflectivity forecasts were obtained from the model with a resolution of 2.8 km (Figure 2b), the most accurate of all the model runs initiated at 06:00 and 12:00 UTC. The forecast obtained from the model started at 12:00 UTC shows a characteristic bow with increased reflectivity north of Suszek. In contrast, in the forecast starting at 00:00 UTC, the predicted reflectivity is shifted to the west, and no significant vorticity was found in this area of interest (Figures 9 and 10). Analogous conclusions can be drawn from the analysis of the maximum reflectivity forecast obtained with a resolution of 0.7 km as shown in Figure 2c. The forecasts of maximum reflectivity values are closest to reality for model runs starting at 06:00 and 12:00 UTC. Similarly to the model forecast with a resolution of 2.8 km, obtained from the run from 00:00 UTC, the area of the maximum reflectivity value did not include the Suszek region. In forecasts for runs starting at 06:00 and 12:00 UTC, the area of maximum reflectivity covers the area where dangerous phenomena occurred. Figure 2c shows the characteristic high reflectivity (bow-shaped echo) that has passed through this region. Comparing the reflectivity predictions obtained from the model with resolutions of 0.7, 2.8, and 7 km with the reflectivity values obtained from the radar showed that the reflectivity values were best predicted by the model with resolutions of 2.8 and 0.7 km (Figures 4 and 5). The analysis of the maximum reflectivity in one-hour steps showed that the characteristic bow echo structures are best represented with the forecast from the model with a resolution of 0.7 km.
Fig. 6.
Maximum values of wind speed at 10 m agl: forecast based on the model results in resolutions (top to bottom) 7.0 km, 2.8 km, 0.7 km from 18:00, 20:00, and 22:00 UTC (left to right).
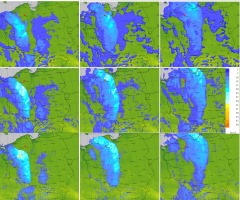
Fig. 7.
Maximum values of wind speed at 10 m agl. Observations at Polish SYNOP stations vs. forecasts, top to bottom, 18:00, 20:00, and 22:00 UTC. Blue diamonds are model results for resolution of 7 km: green squares for 2.8 km, and red triangles for 0.7 km.
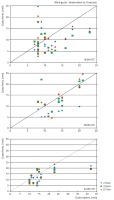
Fig. 8.
Supercell Detection Index 1 values. Forecast based on the model results in resolutions (left to right) 0.7 km, 2.8 km, and 7.0 km from 12:00 to 22:00 UTC. Positive SDI1 values (warm colors) correspond to the updraft, negative (cold colors), and downdraft (Wicker et al. 2005). The red lines connect local maxima of SDI at specific hours (see further explanations in text).

Fig. 9.
Vorticity (vertical component, calculated as average values from 1000 m to 3000 m); forecast based on the model results in resolutions (top to bottom) 7.0 km, 2.8 km, 0.7 km from 18:00, 20:00, and 22:00 UTC (left to right). Warm colors correspond to positive values, cold colors to negative ones.
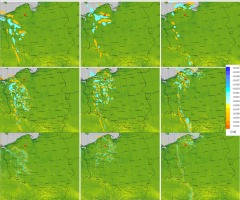
Fig. 10.
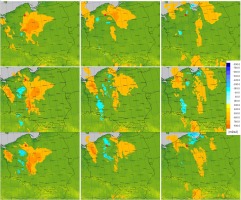
Values of storm-relative helicity 0-3 km; forecast based on the model results in resolutions (top to bottom) 7.0 km, 2.8 km, 0.7 km from 18:00, 20:00, and 22:00 UTC (left to right). Warm colors correspond to positive values, cold colors to negative ones.
All these differences and all the arguments listed above allow for an informed decision that the forecasts starting at 12:00 UTC on August 11, 2017 would be used for further research as the closest to the actual development of the situation. Hence, unless specifically stated, results, description(s), and discussion will pertain to the forecast starting at this hour.
The results presented in Figure 4 allowed for the following conclusion: increasing the resolution from 7 km to 2.8 km significantly improves the results. Comparing the results of the model at a resolution of 7 km and 0.7 km also shows an improvement (as compared to observation), but not necessarily to the extent that one might expect. This result is especially visible when MAE and RMSE are smaller for 2.8 km than for 0.7 km, although both resolutions gave significantly better results than the model at 7 km resolution.
It should be mentioned that there is quite an important conclusion, worth repeating. Increasing the resolution to 0.7 km, at the cost of significantly extending the computation time compared to the model with a resolution of 2.8 km, did not significantly improve the results, at least in terms of reflectivity values.
Figure 5 shows the development of structures identified (cf. Taszarek et al. 2019) in the real radar image and all resolutions of reflectivity forecasts. Even a rough analysis of the actual radar images and the corresponding reflectivity forecasts indicated that an active storm system with the bow echo structure has migrated over Poland for more than four hundred kilometers. The end of the path was positioned, according to the reflectivity forecasts, in the area of the Gdańsk Bay around 23:00 UTC. This pattern is, in general, similar for all resolutions. The following conclusion can be drawn from the qualitative comparison of the position of the maxima and the location of the areas of increased reflectivity on radar images and the model results in all resolutions. It can be concluded that this structure was best captured (at least qualitatively, but not necessarily quantitatively) as a result of calculations using a meteorological model with a resolution of 0.7 km, considering the location(s) related to the time(s) of occurrence of the maximum reflectivity values. This thesis was confirmed by the following figures presenting forecasts (in the same period) of VMAX and SDI1.
Considering the forecast maximum wind speed (Figure 6) and measurements at the SYNOP stations in the study area (Suszek-Chojnice) it should be stressed that while the highest wind speed occurred near Suszek around 20:30-21:00 UTC, Figure 6 shows that the simulations predict an equally strong wind throughout the entire period shown. This qualitative compliance is also valid for data from the Elbląg station (WMO Code 12160), where wind gusts of up to 42 m/s were recorded around 22:00 UTC, that is, after the incident in Suszek. Model simulations showed the maximum VMAX wind speed for Elbląg ranged from 25 m/s for calculations at a resolution of 7 km, to >35 m/s for a resolution of 2.8 km, to >50 m/s at a resolution of 0.7 km. However (see Figure 7), models in all resolutions, compared to measurements at SYNOP stations, rather tended to underestimate the values. This effect occurs for all stations considered, as listed in Table 1, except WMO 12155 in Gdańsk (located over Gdańsk Bay), for which the VMAX values are overestimated. Perhaps this is because the intensity of the phenomenon decreased after reaching the coast, which was not reflected in the model results. High wind speed values are best represented in the 2.8 km model runs for 20:00-21:00 UTC. With the 2.8 km resolution model, the predicted wind speed values were lower than for the 0.7 km version (see Figure 6).
The distribution of the SDI1 values was the most consistent with the actual distribution of dangerous convective phenomena, shown by radar images, based on which it was possible to estimate the potential trajectory of these phenomena with resolutions of 2.8 km and 0.7 km. In the 7 km model, high SDI values were forecast east of Suszek, which suggested a movement of dangerous phenomena in this direction. Although as the resolution increases from 7 to 2.8 km the SDI1 extreme structures (positive and negative) have a more linear than two-dimensional structure, for each resolution a repeating pattern is visible: a maximum followed by a minimum. Could this fact conclusively indicate the presence of a supercell associated with a low-pressure cyclonic circulation system (based on SDI2; Baldauf, Seifert 2008)? It is difficult to answer this question because such structures (clearly marked) cannot be seen at a resolution of 0.7 km. At the same time, it can be observed, especially based on simulations for a resolution of 7 km, that the center(s) of the storm has been moving at an average speed >50 km/h. The maximum speed of the potential supercell was about 100 km/h, and the whole system ended as it reached the Baltic Sea. In addition, it could be seen that between 19:00 and 20:00 UTC the supercell split into two systems (for orientation, in the center of the domain with a resolution of 0.7km, near Toruń and Bydgoszcz). In Figure 8 the red lines, connecting local maxima (with the closest values) of SDI at specific hours, showed the route of the supercell (maximum SDI1 values) with a split into two supercells between 19:00 and 20:00 UTC. This effect was not visible when forecasting the SDI1 index at a resolution of 7 km; also, at a resolution of 0.7 km, this split effect is very weak.
Finally, Figures 9 and 10 show the vorticity and storm-relative helicity at each resolution. Analysis of the results of numerical forecasts obtained from the model at a resolution of 7, 2.8, and 0.7 km suggested a vorticity significantly different from zero, indicating the possibility of intense convective phenomena (e.g., Weijenborg et al. 2017; Figure 9) in the Suszek region forecasts at resolutions of 2.8 and 0.7 km. These values were about 0.005∙s-1 and more. On the other hand, the forecast obtained at resolution 7 km for this hour(s) did not suggest a significant vorticity (>0.0005 s-1) in the Suszek region. In turn, values of SRH greater than 250 m2/s2 may suggest an increased threat of high-impact convective structures (see NOAA webpage for detailed explanation3), but high values of this index do not necessarily suggest that the environment supports supercell formation (Figure 10). Larger values are generally more indicative, but there is, basically, no clear distinction between supercell and non-supercell signatures (NOAA's NWP SPC web page; Markowski et al. 1998). The analysis of the forecast of SRH values at 20:00 and 22:00 UTC from the model at all resolutions did not show that there were any (very) dangerous supercells (Rasmussen, Blanchard 1998) in the Suszek area. Positive values of SRH (warm color on the map) were forecast at all resolutions in the Zachodniopomorskie, Warminsko-Mazurskie, northern Lubuskie, Wielkopolskie, Mazowieckie, Kujawsko-Pomorskie, and Pomorskie voivodeships. In the indicated regions, the projected minimum and maximum SRH values were <–700 and >700 m2/s2, respectively. Negative values of the SRH indicator (anti-cyclonic, i.e., anticlockwise movements; cold color on the map) were forecast in the Pomorskie and Kujawsko-Pomorskie regions with a resolution of 0.7 km, and for Kujawsko-Pomorskie and Dolnośląskie voivodeships with a resolution of 2.8 km. Negative forecast values of SRH from the model at a resolution of 7 km are for very small areas in Pomorskie, Kujawsko-Pomorskie, and Wielkopolskie. Only the forecast from the model at a resolution of 2.8 km for 18:00 UTC in the Suszek area predicted SRH values of about 500 m2/s2, which could suggest the occurrence of dangerous meteorological phenomena, especially supercells. In terms of high-impact weather analysis, it is important to note that sufficiently large values were found around Suszek.
4. Summary
The analysis shows that increasing the model resolution from 7 to 2.8 km better reflects the values of meteorological fields and improves the spatial forecast. It should be noted that the forecasts in higher resolution are burdened with greater errors of MAE and RMSE of surface parameters (results not included in this study in detail), but not necessarily of convective quantities (e.g., radar reflectivities). Increasing the resolution also resulted in a more accurate forecast of the trajectory of a dangerous weather phenomenon.
Increasing the resolution to 0.7 km did not improve the predictions of any variables considered, except for wind gusts. The simulations showed a strong enhancement in maximum wind speed with increased resolution.
To conclude, it should be remembered that the models with resolution greater than 2.8 km were not (and still are not) being launched in the operational mode. In other words, the results of the 0.7 km model were not available at the time of the incident.


