1. Introduction
Dangerous weather phenomena, related to atmospheric convection, are observed in Central Europe mostly in the summer season. Recently, tornadoes, large hailstones, or high lightning activity of the atmosphere during thunderstorms have frequently been observed (Taszarek et al. 2021a-b). In Europe, tornadoes are a rare phenomenon due to a number of complex and non-linear factors in the atmosphere that cause a tornado to form. According to the AMS Glossary of Meteorology, a tornado is defined as a “rotating column of air, in contact with the surface, pendant from cumuliform cloud, and often visible as a funnel cloud and/or circulating debris/dust at the ground” (Glickman 2000, term updated 8 October 2013). Tornadoes occur in a small area for a short time, causing significant material damage and threatening human health or life, making it necessary to precisely forecast them. Forecasting tornadoes in relation to the spatial area, probability of occurrence or time is extremely difficult, and independent climatological studies on tornadoes have been prepared for various areas of Europe (Meaden 1976; Groenemeijer, Kühne 2014; Taszarek, Brooks 2015; Antonescu et al. 2016; Brázdil et al. 2020; Grieser, Haines 2020).
The most severe tornado in Europe in modern era struck on August 19, 1845, in Montville, France, where 80 people were injured. As a result of the reconstruction of the damage caused by the tornado in 1091 in London, it can be stated that over 600 wooden houses were damaged (Meaden 1976). It is assumed that if a tornado of similar strength appeared in “today's” London, the material losses would amount to several million pounds, in addition to the huge threat to the local population. In the 20th century, tornadoes in Europe were usually regarded as strong but rare phenomena, as has been and is happening in the USA (Fujita 1973; Meaden 1976; Peterson 1982). Research covering the area of Europe has confirmed that these phenomena most often form in the June-August period. Comparing the intensity of tornadoes in Europe to those occurring in the United States, tornadoes in the east and west of Europe are more likely to be supercell tornadoes (Antonescu et al. 2016).
The creation of the European Severe Weather Database (ESWD; Groenemeijer et al. 2004; Dotzek et al. 2009), managed by the European Severe Storms Laboratory (ESSL), has led to an increased detection of severe weather events. Mass media now play an important role in documenting phenomena such as hailstorms or damage caused by strong winds. Antonescu et al. (2016) showed that, in the period of 1800-1850, approximately eight tornadoes were reported per year. In contrast, from 2000-2014, 242 tornadoes per year were reported.
Because of the difficulties in data collection, climatological results will always be somehow unreliable. Usually, when information about a destructive tornado or windstorm that passed through an area appears in the media, the event is only memorable until the next similar event. However, because of the ESWD database and other studies documenting particularly dangerous cases of tornadoes or thunderstorms, such events can be more reliably forecasted. In Europe, tornadoes are not a new phenomenon and will continue to appear in the future. However, the ongoing warming and increase in low-level moisture over central Europe might result in the formation of tornadoes with a higher intensity. On the other hand, lower relative humidity levels and a stronger inhibition of convection may mean that thunderstorms in a warming climate, despite increasing atmospheric instability, may not be that severe (Taszarek et al. 2021a)..
Brázdil and co-authors (2020) confirmed that in the Czech Republic, tornadoes reach an intensity of F3 on the Fujita scale. They usually occur in the summer (June, July, August) in the afternoon and early evening hours, when the air temperatures reach their maximums, and the atmosphere is the most unstable. Tornadoes in the Czech Republic can occur in a wide range of Convective Available Potential Energy (CAPE) and with moderate and strong vertical wind shear. More than half of the tornadoes in the Czech Republic occurred under the conditions of MixedLayer CAPE and MostUnstable CAPE under 500 and 900 J·kg-1. A median wind shear value of 20.8 m·s-1 is associated with a well-organized super-cellular convection (Brázdil et al. 2020). Similar studies were carried out for Poland, where the authors found the highest number of tornadoes with force F0 or F1, with similar durations as those in the Czech Republic (Taszarek, Brooks 2015). This study documents the weather conditions that led to the tornado in the Czech Republic on June 24, 2021. Analysis of the convective environment was provided based on ERA5-reanalyses.
2. Area of interest, dataset and methodology
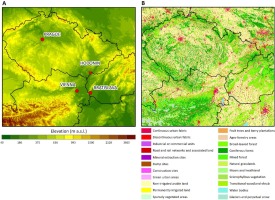
The research area covers mainly the territory of the Czech Republic, but to better visualize the parameters, the test area was extended to the neighboring countries. The Czech Republic is a country with a varied topography, dominated by upland and mountainous landscapes. The lowland depressions are mainly river valleys and depressions, which cover about 24% of the total area of the country (Fig. 1A). The main land use cover types are typical European forests as well as meadows and pastures with arable land (Fig. 1B).
Fig. 1.
A – Hypsometric map of the Czech Republic and neighboring countries based on the Shuttle Radar Topography Mission Global Coverage (SRTM3). B – Land use map of the Czech Republic and neighboring countries based on Corine Land Cover 2018 data.
Data from the European Center for Medium-Range Weather Forecast (ECMWF) ERA5 (Hersbach et al. 2018) model were used to determine the specific weather conditions on June 24, 2021. Reanalysis combines model data with observations from across the world into a globally complete and consistent dataset, using the laws of physics. This principle, called “data assimilation”, is based on the method generally used by weather prediction centers, where every 12 hours (at ECMWF), a previous forecast is combined with newly available observations to produce a new, best estimate of the state of the atmosphere; based on this analysis, an updated, improved forecast is issued. Data has been re-gridded to a regular lat-lon grid of 0.25 degrees for the reanalysis and 0.5 degrees for the uncertainty estimate. There were four main subsets: hourly and monthly products, both on pressure levels (upper air fields) and single levels (atmospheric, ocean-wave, and land surface quantities). Based on the ERA5 resources, values such as atmospheric pressure, air temperature, and dew point at various heights, geopotential, convective available potential energy, total cloud cover, or wind direction and speed were obtained. For this research, among others, data obtained from vertical atmospheric profiles were used; to obtain better results, data from outside the Czech Republic were also included. Parameters such as surface-based Convective Available Potential Energy (CAPE), Lifted Condensation Level (LCL), 0-6-km AGL wind shear, 0-3-km AGL Storm-Relative Helicity (SRH), temperature on multiple levels, or geopotential height were calculated. The hours 1200, 1400, 1600, 1800 were selected to most accurately present the evolution of the atmospheric conditions that contributed to the tornado at 1740 UTC.
Vertical atmospheric soundings are performed in the Czech Republic at two stations (Prague and Prostejov) twice a day, at 0000 and 1200 UTC. The data were obtained from archives of the University of Wyoming. Rawinsonde data also served as reference data for reanalysis (Taszarek et al. 2021b). Data from 1200 UTC from the Prostejov station were selected for the study to most accurately describe the atmospheric parameters.
The synoptic map used to determine the meteorological conditions was generated independently, based on the standardization of various European sources. Designations of the types of air masses were used as described elsewhere (Mishra 2017). However, ERA5 data were used to determine the spatial distribution of atmospheric pressure. To visualize the course and damage caused by the tornado, POLRAD radar data, reports on dangerous weather phenomena from the ESWD database, and Sentinel-2 satellite data were used to assess the route covered by the tornado. Spatial analyses in the form of maps were performed in the ESRI ArcMap 10.8.1 computer software and R programming language (R Core Team 2014).
3. Results
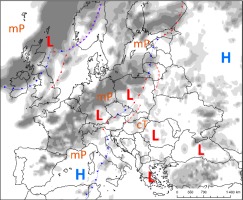
From June 21 to 24, 2021, hot and unstable air of tropical origin flowed across Europe. The development of such a situation was accompanied by a quasi-stationary (wavy) atmospheric front located above the territory of Poland, along with a moving center of low pressure. On Thursday, June 24, the hot air mass over the Czech Republic and Poland was displaced (Fig. 2). According to the latest research, similar synoptic conditions accompanied the formation of high electrically active thunderstorms over Poland (Sulik 2021).
Fig. 2.
Synoptic map at 1200 UTC; cloudiness (shaded), H – high pressure, L – low pressure, cT – continental tropical air mass, mP – maritime polar air mass, warm front – red line, cold front – blue line, occluded front – purple line, convergence zone – red line (based on Polish Institute of Meteorology and Water Management and ERA5 data).
The air of tropical origin reaching Europe for several days from over Africa, the Middle East, and the Atlantic Ocean led to an unstable atmosphere (Fig. 3A). Unstable equilibrium occurs when the current thermal vertical gradient is greater than the adiabatic dry gradient (1°C/100 m), i.e., the temperature drop is, e.g., 1.2°C/100 m. Each parcel of air in this state of the atmosphere will constantly rise because it will always be warmer and lighter than the surrounding environment. This atmospheric state most frequently occurs in the layer near the earth's surface on a hot and sunny day. The accumulated convective energy (CAPE), indicating a favorable thunderstorm environment, is shown in the orange field (Fig. 3B).
Fig. 3.
A – Backward trajectories ending at 1200 UTC on June 24, 2021 (based on the Global Forecast System). The star symbol denotes the location for which model sounding is presented in part B. B – Vertical profile of temperature (red line), dewpoint temperature (blue line) for Prostejov (49°31', 17°05') derived from the thundeR rawinsonde package for R programing language. Orange line denotes the most unstable parcel. Profile indicates the environment just ahead of the approaching convective line.
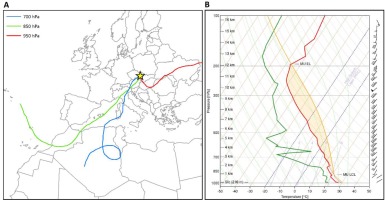
According to the observations on days with strong storms for the area of Europe, CAPE takes values above 1,000 J·kg-1, but in rare cases, the values may exceed 5,000 J·kg-1 (Taszarek et al. 2018). Atmospheric soundings performed at 1200 UTC at the Prostejov station (Czech Republic) showed measured CAPE values around 1,990 J·kg-1 (Fig. 3B). However, even low CAPE values can have a significant impact on the formation of severe storms, especially when in combination with other indicators. The CAPE value depends not only on a sufficiently large vertical temperature gradient but also on the air temperature and humidity in the lower troposphere. As a result of the CAPE analysis carried out between 1200 and 1800 UTC, a significant volatility of the atmosphere, reaching 5,000 J·kg-1, in the early afternoon was reported, which is rare in Europe. The highest CAPE values, exceeding 5,000 J·kg-1, were recorded by rawinsonde on September 13, 2008 (LICT Trapani, Italy), with 6,216 J·kg-1, and on August 23, 2011 (Vienna, Austria), with 5,753 J·kg-1 (Taszarek et al. 2021b).
Near-ground measurements taken on 1200 UTC showed a markedly increased wind speed from 1-3 km AGL, indicating favorable kinematic conditions for thunderstorms in the later hours (Fig. 4A). The rapid increase in wind speed was visible in the higher parts of the troposphere. Strong, vertical ascending movements often develop overshooting tops, indicating the formation of extensive supercell thunderstorms with hailstorms and tornadoes. A model ERA5 hybrid-sigma level sounding from 1800 UTC, displaying the environment while the tornado passed through the town of Hodonín, indicated a well-developed clockwise-curved hodograph (Fig. 4B). This characteristic profile is conductive to the formation of super-cells and severe thunderstorms (Bunkers et al. 2000; Coffer et al. 2020). Declining wind speed at an altitude of 9-12 km AGL suggests a progressive slow disintegration of this particular cell.
Fig. 4.
A – Vertical wind profile for Prostejov (49°31', 17°05') with relative humidity and Theta-e for 1200 UTC, derived from sounding. B – Vertical wind profile for Hodonín (48°50', 17°00') with relative humidity and Theta-e for 1800 UTC, derived from the ERA5 hybrid-sigma level.

High convection energy values were also supported by the wind shear profile at 0-6 km above the earth's surface, reaching 30 m·s-1. Regarding the wind shear in the layer closer to the earth's surface, these values were lower than those at 0-6 km and increased over time, finally reaching 15 m·s-1 at 1800 UTC (Fig. 5).
Fig. 5.
(Left panel) – Surface-based CAPE [J·kg-1] (shaded) and 0-6-km AGL wind shear [m·s-1] (contours and tiles) (central panel) – Surface-based LCL [m AGL] (shaded) and 0-1-km AGL wind shear [m·s-1] (contours and tiles) (right panel) – Lifted index [°C] (shaded) and 0-3-km AGL SRH [m2·s-2] (contours and tiles) (based on ERA5 data).
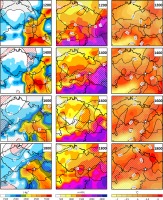
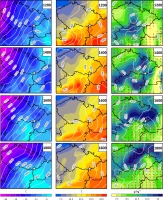
The increase in the values of the indicators over time can also be observed on the example of the lifted condensation level (LCL). Often referred to as the condensation level, this indicator is the height above the earth's surface at which water vapor in the raised test particle of air condenses. Until the LCL level is reached, the rising molecule cools down dry adiabatically, whereas above the LCL, it cools down moist-adiabatic. Numerous but disorganized storms are often observed at low LCLs because convective inhibition (CIN) is low and the lower troposphere relatively moist. On the other hand, at high LCLs (above 2,000 m), there may be a large CIN, especially when isothermal or temperature inversion occurs in the lower troposphere. During previous observations, it was found that LCLs with a height of 500-1,000 m have a positive effect on the development of tornadoes (Belo-Pereira et al. 2017). During the tornado uprising near Hodonín, the LCL reached a value of around 1,300 m. Importantly, the (SRH) index, which determines the potential for rotation within the ascending current in the storm cloud (mesocyclone), remained at 150 m2·s-2 for several hours preceding the upcoming tornado, which, as previous studies have shown, favors the formation of strong whirlwinds (Thompson et al. 2007) (Fig. 5). On the night of June 23 to June 24, a mesoscale convective system (MCS) with a bow echo built in the squall line passed through the territory of the Czech Republic, causing damage by strong winds in the area of Central Bohemia. In the morning hours, the MCS headed towards Poland and moved north-east. The morning storms and the remaining moisture outflow created favorable conditions for the development of subsequent supercell storms in the Czech Republic and Poland on the same day. A similar situation took place on August 10 and 11, 2017, when two extremely strong thunderstorms developed, passing through a large area of Poland, with high electrical activity, strong wind gusts, and severe hail (Taszarek et al. 2019; Sulik, Kejna 2020; Figurski et al. 2021). Convection initiated around 1200 UTC in Austria was possible due to the large thermal gradient in the upper and lower tropospheric layers. Over the Czech Republic, the temperature gradient at a height of 500 hPa was 10°C, and at a height of 850 hPa, the air was heated to a temperature of 24°C, with a mixing ratio in the profile at 0-500 m from 8 to 15 g·kg-1 (Fig. 6).
Fig. 6.
(Left panel) – Temperature [°C] (shaded) and geopotential height [gpm] (contours) at 500 hPa (central panel) – Temperature [°C] (shaded) and geopotential height [gpm] (contours) at 850 hPa (right panel) – 0-500-m AGL ML mixing ratio [g·kg-1] (shaded) and MSLP [hPa] (contours) (based on ERA5 data).
The expanding system of several storm cells merged into one storm cluster around 1700 UTC and entered the Czech Republic around 1720 UTC, becoming a supercell. Such a supercell is a well-organized storm structure which can exist for several hours and move during its entire life cycle for several hundred kilometers at a speed of about 90 km/h or even faster (Sulik, Kejna 2020). Throughout the life cycle of a supercell, highly dangerous storms may occur within its range. The core of the storm is a swirling ascending current (called a mesocyclone). Rotation in the ascending current allows the supercell to soar higher and more rapidly than a normal storm cell (Fig. 7A). A supercell can be considered a very low-pressure system; its size does not exceed 40-60 km, and the center of the low pressure is located in the mesocyclone. Some mesocy-clones spin extremely strongly, and when the appropriate thermal conditions are present and the air in the lower troposphere is sufficiently humid, tornadoes may develop. Ongoing research is still unable to answer the question of why one supercell generates a tornado and another does not. The supercell that entered Czech territory was also distinguished by large hail and heavy rain. The tornadic supercell, after creating the tornado, moved north-east, absorbing smaller storm cells into its structure. June 24 was also specific in terms of heavy hail events (Fig. 7B).
Fig. 7.
A – Maximum reflectivity between 1700 and 2000 UTC with 10-minute steps (based on POLRAD data). B – Severe weather reports on June 24, 2021 (based on the European Severe Weather Database). Star symbol denotes tornado location.
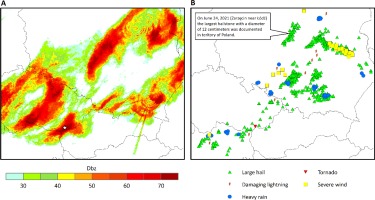
On that day, the largest hailstone (with a diameter of 12 cm) that ever fell in Poland was documented in Zarzęcin near the Łódź City (central Poland). Based on satellite data from Sentinel-2 and the damage caused by the tornado, it was possible to reconstruct the tornado path (Fig. 8A). For the first time, the tornado hit the ground near the town Hrušky. At this point, the tornado was only taking its mature stage, so the damage was not as violent as in other places on the further path of the tornado. The traces of further activity showed that, for a while, the main core of the mesocyclone lost its connection with the ground and regained it several times after a few meters, descending to the ground near the village of Moravská Nová Ves. It remained in contact with it until leaving the town of Hodonín, destroying Mikulčice and Lužice on the way. Around 1745 UTC, the tornado reached the city of Hodonín, where it caused the greatest damage (Fig. 8B).
Fig. 8.
A – Tornado track on June 24, 2021. B – Aftermath of the violent tornado in the town Hodonín. Photography: Severe Weather Europe.
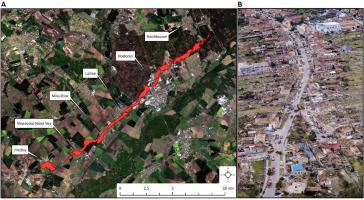
The damage done on the tornado route was assessed via force EF3 on the Fujita scale. This means that at the tornado crossing point, the wind hit at a speed of 218-266 km/h. The EF scale is nothing more than an updated scale for assessing the force of a tornado, proposed by Ted Fujita in 1973. The designation EF3 (former F2) denotes severe damage characterized by the significant destruction of solid structures such as residential buildings and shopping malls. Trees are usually badly broken, cars overturned and moved elsewhere, and poorly constructed buildings are completely destroyed (Fujita 1973). At its widest point, the tornado was about 70 meters wide (Fig. 9).
When leaving Hodonín, the tornado continued toward north-east, where it entered areas less inhabited by people. It destroyed hectares of forests, and its trail ended near Ratiškovice.
4. Conclusion
June 24, 2021, saw one of the most severe weather events in Europe. Against the background of a changing climate, such events will become more frequent in the near future. For example, each additional 0.5°C causes a marked increase in the intensity and frequency of heat waves and heavy rainfall. With a 1.5°C warming, the frequency of extreme events, also severe thunderstorms evolving into tornadoes, will increase (IPCC 2021). In this context, particular attention should be paid to the phenomena that are taking place, their strength, and their impacts on human health and life as well as material. On June 24, 2021, several serious thunderstorm incidents took place in Central Europe, with losses estimated at several billions of euros. The tornado that occurred in the Czech Republic was created mainly due to the hot and unstable mass of air of tropical origin. Favorable kinematic conditions in the form of CAPE values around 5,000 J·kg-1 and an SRH around 150 m2·s-2 allowed the storm cloud to rise to a height of 12 km (Equilibrium Level, strong vertical wind) to later take the form of a mesocyclone storm supercell, which generated a tornado with the force of EF3/T5 on the Fujita/TORRO scale. On that day, high precipitable water levels in the troposphere >50 PW and a strong vertical wind profile at the level of 0-6 km AGL of 30 m·s-1 also contributed to various incidents, with hailstones reaching a diameter of more than 2 centimeters. In a climatological study on tornadoes in the Czech Republic, the authors indicate that the strongest tornadoes in this area in the entire history of this country had the maximum force of F3 and F2 (Brázdil et al. 2020). It can therefore be concluded that the tornado of June 24, 2021, was one of the most powerful incidents in history. As a result of the devastating tornado passing through the centers of some Czech towns, 6 people lost their lives, about 200 were seriously injured, and several hundred houses and cars were completely destroyed. Further studies on strong thunderstorms in Europe are necessary for their better understanding and prediction by specialists.

