1. Introduction
Renewable energy sources are becoming increasingly important in the global effort to mitigate climate change (Moomaw et al. 2012). The shift toward renewables, such as solar and wind energy, is driven by the need to reduce greenhouse gas emissions and dependency on fossil fuels. However, the variability of these energy sources poses challenges for energy systems, particularly in ensuring consistent energy supply (Pryor et al. 2005; Harrison, Wallace 2006; Jerez et al. 2015). The impact of climate change on weather patterns further complicates the matter, potentially exacerbating periods of energy surplus and deficit.
In Poland, the adoption of photovoltaic (PV) systems has seen significant growth in recent years, supported by favorable policies and technological advances (Igliński et al. 2023). Conversely, onshore wind turbines experienced a decline in new investments as the result of regulatory and market challenges. However, the situation is likely to improve in response to new regulations concerning the siting of wind parks relative to human settlements.
The reliability and safety of the energy system are critical concerns, particularly in the face of energy droughts (periods of very low energy production) and energy floods (periods of very high energy production). These extremes are often influenced by weather conditions, which can lead to significant fluctuations in renewable energy output. Understanding these patterns is essential for developing strategies to stabilize the energy grid and ensure a reliable energy supply.
Circulation-type calendars, such as the Litynski classification developed for the territory of Poland, as well as the Grosswetterlagen classification focused on Central Europe (particularly Germany), classify atmospheric circulation patterns and their impacts on weather. These classifications are critical for understanding weather variability and its implications for various environmental and climatic studies (Ustrnul et al. 2010, 2013; Wypych et al. 2014; Ustrnul et al. 2015; Wypych et al. 2017). The Litynski calendar, developed by Jan Litynski in 1969, categorizes 27 types of atmospheric circulation based on sea level pressure over Central Europe (Lityński 1969). Similarly, the Grosswetterlagen classification (initially named the Hess-Brezowsky classification), first published in 1952, provides a framework for analyzing synoptic weather patterns over Central Europe and their long-term climatic impacts (Hess, Brezowsky 1952). The COST733 project further harmonized these classifications across Europe, facilitating the comparison of various methods and their applications in climate research (e.g., Huth et al. 2008; Niedzwiedź, Lupikasza 2019; Niedźwiedź, Ustrnul 2021).
Circulation types play a pivotal role in determining the availability of renewable energy resources (Correira et al. 2017; Grams et al. 2017). Different atmospheric circulation patterns can lead to variations in wind speed and solar irradiance, directly affecting the performance of wind turbines and PV systems. By analyzing these weather types, it is possible to predict periods of low and high energy production, enabling better planning and management of energy resources. Van der Wiel et al. (2019) investigated the impact of large-scale weather regimes on renewable energy production and energy demand in Europe. Their findings indicate that certain weather regimes, such as 'Scandinavian blocking' and 'North Atlantic oscillation negative', lead to lower renewable energy production and higher energy demand, increasing the risk of energy shortfalls. Similarly, Dumas et al. (2019) assessed the vulnerability of electrical grid components to extreme weather events, emphasizing the need for resilient energy systems capable of adapting to these challenges (Dumas et al. 2019; Van der Wiel et al. 2019). Moreover, Gonçalves et al. (2024) and Muyuan et al. (2023) examined the variability in wind and solar energy production under different weather regimes. They highlighted the complexity of predicting energy shortfalls based solely on large-scale weather patterns and underscored the importance of accurate weather prediction models for effective energy planning and management.
Understanding the relationship between weather patterns and renewable energy production has significant implications for energy policy and management (del Rio et al. 2018). It can inform the development of policies that support the integration of renewable energy into the grid, enhance predictive maintenance of energy infrastructure, and improve the design of energy storage systems to buffer against production variability (Brown, Reichenberg 2021).
With these considerations, the main goal of this study is to evaluate the relationship between different weather circulation types in Poland and the occurrence of periods with very low (droughts) and very high (floods) production of wind energy. By establishing this relationship, the study is directed toward providing insights into the impacts of weather patterns on renewable energy production, thereby contributing to more resilient and adaptive energy systems.
2. Material and methods
The primary data source for this study is the ERA5 reanalysis dataset, which provides a comprehensive set of atmospheric and surface parameters at high spatial and temporal resolution (Hersbach et al. 2020). Specifically, we utilized the u and v wind components, temperature, and specific humidity data from the 133rd model level, which is the closest to 100 m above ground level (agl) in the ERA5 model. Additionally, surface-level air pressure data were extracted to facilitate further calculations.
Wind speed at the height of 100 m agl was adjusted for variations in air density, which can significantly affect the actual wind speed experienced by wind turbines (Hoxha et al. 2023). The steps and formulas are specified in the supplementary materials. For computations of power generation with specific wind speed, a 3.5 MW wind turbine was used (https://en.wind-turbine-models.com/turbines/1247-vestas-v112-3.45, data access 2024.07.01).
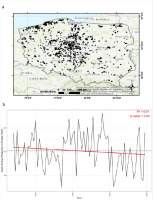
To accurately assess wind energy production across Poland, the locations of wind turbines were extracted from OpenStreetMap (OSM, https://www.openstreetmap.org, data access 2024.07.01). The final database consisted of 4949 wind turbines (Fig. 1a) with simulated yearly wind energy production (Fig. 1b). Using these coordinates, the potential power generated at each turbine site was calculated by applying wind speed data from the ERA5 reanalysis dataset nearest point. The wind speed values, adjusted for air density, were used to estimate the power output based on the specific power curve of the wind turbines (Jurasz et al. 2024).
Fig. 1.
Locations of OSM turbines (a) and simulated yearly wind energy production from OSM turbines in Poland (b).
The Litynski calendar of circulation types was used to categorize atmospheric circulation patterns affecting Poland (Lityński 1969; Pianko-Kluczyńska 2007; Nowosad 2008; Kulesza 2017). This calendar classifies circulation types based on synoptic situations. By linking these circulation types to wind speed and energy production data, we analyzed how different atmospheric patterns impact wind energy generation. This classification helps in understanding the variability of wind energy production in relation to prevalent weather conditions.
The frequency of energy droughts and floods using specific thresholds was calculated to analyze the impact of circulation types on renewable energy production. Droughts were defined as days when energy production fell below the 20th percentile, and floods as days when production exceeded the 80th percentile. Using R, occurrences of droughts and floods were classified and their frequencies for each circulation type were computed. This was achieved using the dplyr (Wickham, Francois 2014) and ggplot2 (Wickham 2016) libraries, which facilitated the analysis and visualization of trends and seasonal variations.
3. Results
3.1. Trends in energy droughts and floods
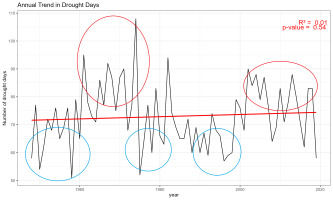
Figure 2 shows the annual trend in drought days from 1948 to 2019, indicating variability with some noticeable peaks and dips. Notably, there are several years with a high number of drought days, such as from the early 1960s to the early 1970s and from the 2000s until the end of the period, with peak counts reaching 108 days in 1974. Conversely, there are periods with fewer drought days, particularly in the 1950s, 1970, and 1990s, with counts dropping to 51 days in 1958. Despite this variability, the overall trend shows a slight increase, but this trend is not statistically significant (p-value 0.54).
Fig. 2.
Trends in annual number of days with energy droughts. Periods with high or low numbers of drought days are highlighted with red or blue shapes, respectively.
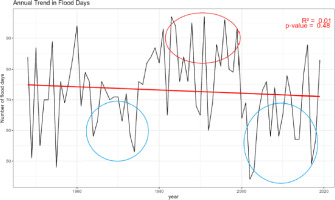
Similarly, the annual trend in flood days over the same period shows significant fluctuations (Fig. 3). High flood day counts are observed from the 1980s to the 1990s, with peaks reaching 97 days in 1983 and 1991. On the other hand, the number of flood days decreased in the early 1970s and early 2000s, with counts dropping to 44 days in 2002. The overall trend indicates a slight decrease in flood days, yet this trend is also not statistically significant (p-value 0.48).
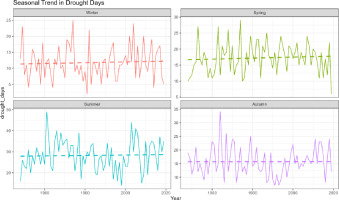
The seasonal trends in drought days reveal distinct patterns across different seasons (Fig. 4). The number of drought days in autumn fluctuates between 10 and 35, with occasional peaks above 30, particularly in the 1960s. The overall trend is relatively stable, with a slight increase that is not statistically significant. Drought days in spring range from 5 to 25, showing a general decrease over time. Peaks are observed in the late 1950s, 1960s, and mid-1970s, but the trend is not statistically significant. Summer exhibits the highest variability, with drought days ranging from 20 to 50. Notable peaks occur in the early 1960s and mid-2000s. The overall trend shows a slight decrease, but this is not statistically significant. Winter drought days vary from 5 to 25, with peaks in the 1950s, early 1970s, 1980s, and 2000s. The overall trend remains stable with no significant changes.
Fig. 4.
Trends in annual number of days with energy droughts in seasons with different ranges on the y-axis to highlight seasonal variability.
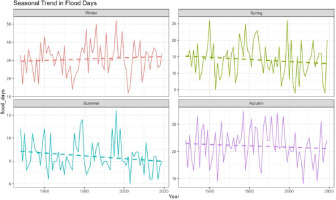
Flood days in autumn (Fig. 5) fluctuate between 10 and 35, with noticeable peaks in the 1950s, 1970s, and 1990s. The overall trend is stable with a slight decrease, not statistically significant. In spring, flood days vary from 5 to 25, showing a general decrease over time, with peaks in the 1960s, early 1980s, and 1990s. The trend is not statistically significant. In summer, flood days range from 0 to 15, with high variability and peaks in the early 1970s and late 1990s. The overall trend shows a slight decrease, which is not statistically significant. In 2003, there were no flood days. Winter was the most variable season, with flood days ranging from 10 to 50 and noticeable peaks in the late 1980s and mid-1990s. The overall trend remains stable, without significant changes.
3.2. Circulation types
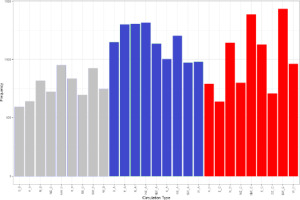
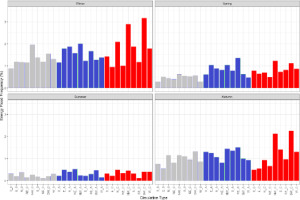
The frequency of different atmospheric circulation types varies significantly in Poland, influencing the country's weather patterns over time. Figure 6 shows the frequency of these circulation types from 1948 to 2019, highlighting the distribution and dominance of specific types throughout this period. Circulation types are categorized along the x-axis, with their corresponding frequencies on the y-axis. The bar chart is color-coded to differentiate between the various circulation types. The grey bars represent circulation types without significant cyclonic or anticyclonic dominance (neutral pressure pattern), blue anticyclonic, and red cyclonic types, showing distinct variations in their occurrences. Notably, certain types, particularly those represented by the blue (E, N and NE winds) and red bars (SW and NW winds), appear more frequently than others.
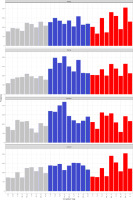
Figure 7 presents the frequencies of circulation types in different seasons of the year. In autumn, the most dominant are cyclonic types with SW and NW winds; in spring, anticyclonic types with NE and N winds; in summer, anticyclonic types with NE and N winds; and in winter, cyclonic types with SW winds.
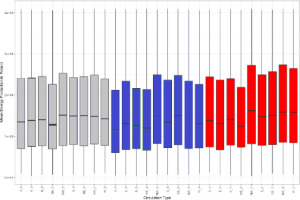
Having assigned circulation types for all days in this database, for days with a given circulation type, the mean daily sum of wind energy that could be produced by all wind turbines in Poland was calculated. Figure 8 shows that the highest values of daily wind energy are expected on days with anticyclonic circulation types and NW winds, while the lowest values are for anticyclonic types with no advection.
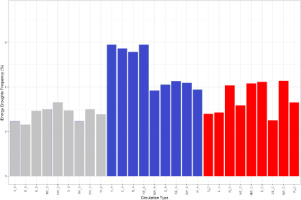
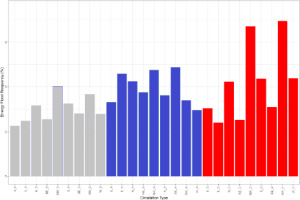
As defined in Section 2, the frequency of energy droughts (Fig. 9) and floods (Fig. 10) were calculated for circulation types in Poland. While cyclonic types with N, NE, and E winds and without advection are the most likely associated with energy droughts, anticyclonic types with NW and SW winds are strongly connected to the energy of floods. Days with cyclonic types with SE winds are responsible for the least number of droughts and the greatest number of floods.
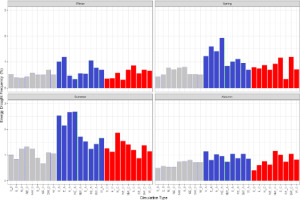
Figures 11 and 12 present the frequencies of drought and flood days by season. Droughts are least common in winter and autumn. Usually, anticyclonic circulation types are responsible for the largest number of droughts, which are mostly visible in summer and spring. On the other hand, floods are seldom seen in summer, mostly associated with cyclonic circulation types.
4. Discussion
The findings of this study underscore the significant impacts of atmospheric circulation types on wind energy production in Poland. Analysis of data from 1948 to 2019 reveals that specific circulation types are related to very low (energy droughts) and very high (energy floods) wind energy production. These insights are critical for improving the reliability and resilience of renewable energy systems.
The results indicate that cyclonic circulation types, particularly those with NW winds, are most conducive to high wind energy production. These patterns tend to create stable, strong wind conditions that are ideal for wind turbines. Conversely, anticyclonic circulation types, especially with N, NE, and E winds, are more likely to result in less favorable wind conditions conducive to energy droughts. This understanding can help in forecasting and managing wind energy production more effectively.
The study highlights distinct seasonal variations in wind energy production. For instance, summer and spring exhibit higher variability in energy production, with anticyclonic types leading to more stable conditions in summer, whereas winter and autumn show more consistent patterns with cyclonic types. This seasonal insight is crucial for planning energy storage and distribution, ensuring that energy supply can meet demand throughout the year.
The ability to predict periods of energy surplus and deficit based on atmospheric circulation types has profound implications for energy policy and management. Policymakers can use these findings to develop strategies that enhance the integration of renewable energy into the national grid. For example, during anticipated periods of energy drought, alternative energy sources or stored energy can be used to maintain a stable supply. Similarly, during energy floods, excess energy can be stored or redistributed to avoid curtailment.
Understanding the relationship between weather patterns and wind energy production can help in designing more robust energy systems. By anticipating periods of low and high production, energy providers can better manage grid stability, e.g., by optimizing the use of energy storage systems, improving the maintenance schedules of wind turbines, and ensuring that the energy grid can handle fluctuations in energy production without compromising reliability.
This study, while comprehensive, has several limitations. The use of the ERA5 reanalysis dataset provides a high level of detail, but real-world factors such as turbine maintenance, operational efficiency, and local topography were not fully accounted for. Additionally, while the Litynski calendar of circulation types offers a robust framework for categorizing weather patterns, future research could benefit from incorporating more localized meteorological data and advanced predictive models. This research also has employed a simplified approach, assuming that all wind turbines have the same power and height, which is not the case in reality, although there are not sufficient data to examine the question in greater detail.
Further research is needed to explore the long-term impacts of climate change on these atmospheric circulation patterns and their subsequent effects on wind energy production. Understanding how these patterns might shift in the future will be crucial for developing adaptive strategies that ensure the continued growth and stability of renewable energy systems in Poland.
5. Conclusion
This study provides insights into the relationship between atmospheric circulation types and wind energy production in Poland. By identifying the weather patterns that lead to energy droughts and floods, this research contributes to the development of more resilient and adaptive energy systems. These findings are essential for policymakers and energy planners aiming to enhance the reliability and efficiency of renewable energy sources, ultimately supporting the transition to a sustainable energy future.
The authors also see the rationale for using other classifications of circulation types, including those based on automated methods (e.g., using machine learning techniques), to assess their impact on electricity production. It is necessary to examine to what extent the application of mesoscale classifications will allow for an even better determination of the influence of circulation conditions on anemological conditions.

