1. Introduction
The amount of precipitation over a certain period of time is the principle limiting factor for crops growing in rainfed agriculture conditions across arid zones. The level of initial moisture content in a particular field (at sowing or seedling emergence) is typically employed as an initial parameter in crop modeling and is determined via field surveys (estimated moisture from soil samples or soil moisture sensors), water balance calculations based on the agrohydrological modeling of the preceding period and remote sensing (RS) data. The spatial resolution of the data services that provide soil moisture information from the upper 3-5 cm soil layer and the layer up to 1 m are currently relatively low, at approximately 25 × 25 km and 10 × 10 km respectively, with data delays from 3 days up to 3 months (Karthikeyan et al. 2017; Yee et al. 2017). Such resolutions allow for the application of the datasets in global modeling, but not for their direct usage in the monitoring and forecasting of tasks in the field. Furthermore, in arid zones, particularly in rainfed conditions, precipitation can be highly variable, the measurement accuracy of which, its spatial and temporal variation, often determines the accuracy of water balance calculations and crop growth simulation results.
One of the most significant achievements of the last two decades in global precipitation measurements has been the Tropical Rainfall Measuring Mission (TRMM) (Liu et al. 2012), a joint project between NASA and the Japan Aerospace Exploration Agency (JAXA). TRMM was originally intended to run for 3 years, yet it was deployed for more than 15 years (1997-2015). During this mission, many developments, basic algorithms and global approaches were determined to assess the interrelation of the atmospheric processes connected with the water cycle, including the application of microwave radiometers for precipitation measurements (Ebert et al. 2007; Huffman et al. 2007; Liu, Zipser 2015). Despite the significant raster size of the precipitation fields (spatial resolution 0.25º or approx. 500 km2 for the steppe territory of the Crimean Peninsula, with a temporal resolution of 3 hours), numerous studies have been performed to assess the accuracy of satellite-derived precipitation data (Chokngamwong, Chiu 2008; Scheel et al. 2011; Chen et al. 2020). A particularly important area of research is the application of satellite data to solve hydrological tasks (i.e., river water resource management) using the basin approach (Kidd et al. 2009; Liu et al. 2015).
The scientific and technological developments of the TRMM mission were subsequently employed during the preparation of the new Global Precipitation Measurement (GPM) mission (Hou et al. 2014), which began in 2014. The satellites and data integration methods used in this mission increased the spatial and temporal accuracy of the data, with corresponding resolutions of 0.1º and 30 min, respectively (Wang et al. 2018). This spatial resolution (grid area 85.8 km2) is comparable to the average area of a rural settlement in the steppe Crimea (95 km2) and exceeds the average area per stationary weather station in the Crimea (i.e., on an area of approx. 1,700 km2). This allows for (considering data availability), more than 20 additional geo-referenced precipitation estimations averaged for the area of each grid across the central Crimea district.
Primary raster precipitation data decomposition using data from satellite imagery was developed within the Famine Early Warning System Network (FEWS NET) project and can represent fields of estimated precipitation distributions with a raster size of 0.05º (Funk et al. 2014). This spatial resolution surpasses that of the GPM mission (GPM IMERG dataset). The technology has been developed since 1999 by scientists from the University of California in collaboration with the U.S. Geological Survey (USGS) in order to produce precipitation geo-referenced grids, which are particularly important in sparse data regions. The current version of the methodological approach includes data from weather stations and precipitation gauge posts, spatial variation modelling of precipitation interrelated with the terrain, and data from the satellite monitoring of precipitation. This methodology is primarily focused on the monitoring and forecasting periods of severe drought or floods in order to develop measures to mitigate their impact. Its application range is wide and the supported geospatial database of numerous meteorological parameters, including precipitation, continues to be verified in various regions across the world (Funk et al. 2015; Paredes-Trejo et al. 2017; Dinku et al. 2018; Saeidizand et al. 2018).
Multiple approaches are used to test the Integrated Multi-satellitE Retrievals for GPM (IMERG) and FEWS – the Climate Hazards Group InfraRed Precipitation with Station (CHIRPS), including direct comparisons with ground-based data on measured precipitation (Ning et al. 2016; Nashwan et al. 2019; Satgé et al. 2019); cross-comparisons with other products and ground-based data (Wang et al. 2018; Beck et al. 2019; Xiao et al. 2020); and indirect estimations obtained by assessing the accuracy of runoff models (Pang et al. 2020). The generalized analysis of these publications demonstrates that in most cases, several factors (topographic features, wet or arid regions, winter or summer periods, frequency of extreme precipitation events, etc.) prevent the selection of the optimal database or methodology (Tang et al. 2020; Xiao et al. 2020).
The technologies for remote precipitation measurements are constantly improving, with sampling times of 30 min (and more) and high spatial resolutions of 0.05-0.1º, allowing their application in seasonal planning and regional analysis tasks, as well as their integration with additional ground-based observations for technological decisions at the field level. The necessity of such information is primarily caused by the low number of stationary and automated weather stations in some regions, as well as the practical impossibility of obtaining regular spatial data of measured precipitation from “field” precipitation gauges (particularly in winter with snowfall).
The aim of this study is to compare the accuracy of spatial field precipitation estimations obtained via the GPM IMERG and FEWS CHIRPS products, with gauge-based precipitation data employed for spatial agro-technological monitoring and planning. We hypothesize the potential difference in the relationship between the precipitation data of the RS products and the ground observations of the weather stations, which have different levels of data accessibility for end users (free open access or limited by price, continuity, etc.).
The level of applicability of the products for agricultural areas within the steppe region of the Crimean Peninsula is demonstrated by comparing the usage of gauge precipitation data from weather stations, GPM mission data (GPM IMERG v06 products – GPM_3IMERGM, final run and GPM_3IMERGDL late run datasets) and the early warning system of extreme situations FEWS NET (CHIRPS 2.0 product).
2. The study area
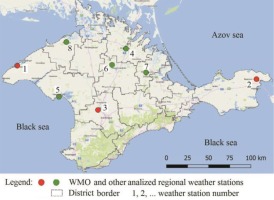
The Crimean Peninsula is located between 44º38' and 46º15' latitude, 32º48' and 36º65' longitude and is surrounded by the Black and Azov seas almost from all sides. According to the integrated indicators of agro-climatic resources, the territory of the peninsula is divided into 4 zones: steppe; foothills; mountain; and southern coast. The Crimean steppe region occupies almost 75% of the peninsula territory and is characterized as semiarid prairie land. This zone is located between temperate (the northern and central part of the Crimea) and subtropical (the southern part of the peninsula, which is protected from a colder climate by the Crimean mountains) climate belts. The climate of the steppe plains is continental and moderately warm. The average annual air temperature is 11.0°C, ranging from 10.3 to 11.8°C, while the average annual precipitation in the central zone of the steppe is approximately 450 mm (Klepynine weather station, no. 6 in Fig. 1). The amount of precipitation throughout the steppe varies (spatially) from 366 to 484 mm on average per year, and from 200 to 773 mm over the years for the weather stations of the steppe zone.
Fig. 1.
Location of the weather stations used for analysis in the territory of the Crimean Peninsula.

A total of 8 weather stations were selected to carry out a comparative analysis of the RS-estimated precipitation with ground-based observations. Their zone of representativeness covers almost the entire territory of the Crimean steppe zone (Fig. 1). Data from 3 weather stations are available (free open access to long-term continual daily data) from the databases associated with the World Meteorological Organization (WMO). Table 1 reports the details of the weather stations used in the analysis.
Table 1.
Weather stations characteristics.
* National Climatic Data Center (NCDC) weather station number.
The weather stations listed in Table 1 are grouped as “WMO” and “regional’ stations. Note that “regional” stations also have ID station numbers and use the same equipment for precipitation measurements as the “WMO” stations.
3. Materials and methods
GPM datasets on the spatial distribution of monthly precipitation totals for Crimea territory collected between January 2017 and July 2020 were downloaded using the Giovanni service1, according to the FEWS Network2, ground data of daily precipitation totals are taken from the data of the open archive of the Rp5 weather informer3 and WMO related the National Climatic Data Center database4.
Raster images of precipitation distribution fields for the Crimean Peninsula derived from GPM IMERG and CHIRPS were read in GeoTIFF format. The numerical values of precipitation were read from the grids corresponding to the weather stations locations and written to the vector weather station layer (using the QGIS 3.10 point sampling plugin).
In order to analyze the convergence between the weather station data and the estimated values of the GPM_3IMERG and CHIRPS products, we employed the following statistics for monthly precipitation totals across January 2017 – July 2020: the bias, which represents the overestimation (>1) or underestimation of the measured parameter (<1); the mean error (ME) or difference, where positive/negative values indicate the average overestimation/underestimation per month compared to the basic parameter (mm); the root mean square error (RMSE) or standard deviation shows the level of precipitation variation in physical units (mm) over the months; the Pearson correlation coefficient (r) and coefficient of determination (r2) characterize the strength of relation or dependence between compared parameters (commonly used qualitative characteristics for different r levels are 0.40-0.59 “moderate”, 0.60-0.79 “strong”, 0.80 and higher “very strong”, or “functional” if r = 1.0); the Nash–Sutcliffe efficiency coefficient (NSe) is used for the accuracy estimation of the RS products compared to the ground based observations, where the closer the value is to one the higher the association between the measured precipitation and satellite estimations, and a zero value indicates that the predictive properties of the satellite estimations are equal to the forecast (Dembélé, Zwart 2016).
The average (AVG) and maximum and minimum (MAX and MIN) values of the measured and estimated monthly precipitation totals were also employed to analyze the differences in their absolute values during the analyzed period. The aforementioned statistics were calculated as follows:
where Pi and Pav are the sum precipitation per month i and the averaged value of monthly precipitation totals, respectively [mm]; PM and PRS are the monthly precipitation totals, measured and estimated by RS, respectively [mm]; PMav and PRSav are the averaged value of the monthly precipitation totals measured and estimated by RS, respectively [mm]; and n is the total number of months.
The determination coefficient (r2) was determined as the square of the correlation coefficient. The least-squares method was applied for the calculation of the linear regression coefficients.
4. Results
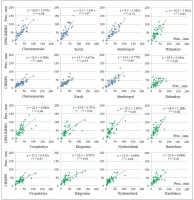
We compared the monthly precipitation total for the period of January 2017 – July 2020 in order to assess the strength of the association between the precipitation data derived from the RS methods (GPM IMERG and CHIRPS) and the ground-based observation data from the weather station network. Figure 2 presents the relationship between the measured and estimated values of monthly precipitation totals. The blue and green weather stations denote those with freely available data through the WMO network and several other regional weather stations of the steppe region in the Crimea, respectively. The y-axis provides information on the RS monthly precipitation totals while the x-axis presents the equivalent data from the weather stations.
Fig. 2.
Relationship between weather station precipitation data and equivalent RS estimations (GPM MERG, final run and CHIRPS). Blue – WMO network; green – regional stations.

Both RS products exhibit a significantly higher correlation with the WMO network weather station data (average determination coefficients are 0.65 and 0.62) than with other regional stations, with average r2 values of 0.51 and 0.49 for the GPM IMERG and CHIRPS products, respectively.
The GPM IMERG product exhibits the highest correlation with the ground-based data, with r2 values of 0.67 and 0.71 (“very strong”) for the Kerch and Simferopol stations, respectively. The lowest correlations were determined between CHIRPS and the Dzhankoy station (r2 = 0.29, “moderate” level). The remaining stations exhibited a “strong” correlation, with coefficients of determination ranging from 0.41 to 0.63.
A direct comparison between the ground data (measured at the individual points of the rain gauge location) with model estimations of the precipitation values averaged over the pixel area (0.1º or approx. 85.8 km2, and 0.05º or 21.4 km2 for GPM IMERG and CHIRPS, respectively) is not entirely correct. However, taking into account that the same approach is used to compare the correlation between both products, this disadvantage in the methodological approach can be neglected. Table 2 reports the resulting statistical indicators of the analysis.
Table 2.
Comparison of satellite and ground-based precipitation estimations between January 2017 and July 2020.
The average amounts of the monthly precipitation for the entire study period across weather stations determined by the stations, GPM IMERG and CHIRPS were 30.4 mm, 52.0 mm and 37.2 mm, respectively, while the latter two overestimated the ground-based measurements by 21.6 and 6.8 mm (ME) per month.
The absolute deviations of the minimum RS monthly precipitation estimations from the equivalent weather station values (MIN) are low, ranging from 0.4 to 8.3 mm and 4.0 to 9.7 mm for GPM IMERG and CHIRPS, respectively. Moreover, the minimum values determined from CHIRPS exceed those of the ground-based and GPM values for all weather stations.
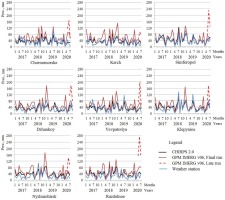
The absolute deviations of the maximum RS monthly precipitation estimations from those measured at weather stations (MAX) are significant for both products, varying within 25.0–91.5 mm and 15.4–45.1 mm for GPM IMERG and CHIRPS, respectively. The CHIRPS product exhibits both positive and negative deviations, while the GPM IMERG product presents consistent excess values. This can be observed in Figure 3, which depicts the variations in the measured and estimated monthly precipitation totals.
Fig. 3.
Monthly variations of ground-based and RS-estimated precipitation. RS products are CHIRPS 2.0 and GPM IMERGM v06 final run across the entire study period and GPM IMERGDL v06 late run for the last three months.

The magnitude of the precipitation variations per month, characterized by the RSME value, is equal to 21.9 mm for meteorological stations on average and variations ranging between 18.0 and 30.0 mm across the study period. The CHIRPS estimations exhibit slightly lower values for 7 out of 8 stations, with an average RSME of 18.7 mm and variations within 16.2-22.8 mm. An average value of RMSE, according to the data of the GPM IMERG product, is equal to 32.0 mm (range of 30.0-33.9 mm), and exceeds the value of this parameter, calculated on the base of the gauge data, for each of all weather stations..
The average values of the correlation coefficients between the measured and estimated monthly precipitation totals are 0.75 and 0.73, with ranges of 0.64-0.84 and 0.53-0.81 for GPM IMERG and CHIRPS, respectively.
The bias parameter values confirm the overestimation of the ground-based monthly precipitation totals by the equivalent RS estimations (with the exception of the CHIRPS estimations at the Chornomorske station). The average bias values are determined as 1.75 and 1.24, with deviations 1.32–2.12, and 0.98–1.58 for GPM IMERG and CHIRPS, respectively.
The ability of the time series RS-estimations to predict the ground-based monthly precipitation totals vary across the RS products, with average efficiency coefficient NSe values of 1.28 and 0.31 and ranges of – 2.75 to –0.23 and –0.45 to –0.63 for GPM IMERG and CHIRPS, respectively. The Nash–Scutliff efficiency coefficient values indicate the CHIRPS product as a more effective predictor of the ground-based observed monthly precipitation time series compared to GPM IMERG for all stations (with the exception of the Razdolnoe station, with a negative CHIRPS NSe value).
The level of variation in the precipitation estimated by the CHIRPS and GPM IMERGM final run products compared to the gauge data confirms the statistical analysis presented in Table 2. However, the maximum monthly total precipitation determined by the GPM final run product (corresponding to December 2018 for 6 stations) demonstrates the requirement for additional calibration with the refinement of the resulting estimations for the region.
Considering that the final precipitation estimations determined via the GPM IMERG product have a 3 month delay in availability, the dashed line in Figure 3 allows us to estimate the magnitude of the discrepancy in monthly precipitation totals for the end of the period. The average late run overestimation compared to the final run is determined as 59.2 mm per month and 88.7 mm for the entire study period. Furthermore, the maximum deviation of 263.7 mm per month is observed for the Razdolnoe weather station in June 2020.
5. Discussion
The main advantage of precipitation data derived from the satellite measurements in agricultural monitoring tasks is their availability (free open access), high temporal resolution (1-5 days or higher) and improved spatial resolution (0.05 and 0.1º for CHIRPS and GPM IMERG, respectively). The weather station network available in the steppe region of the Crimea does not permit the evaluation of precipitation variations within the districts as there is approximately one station per district. The application of the RS-derived precipitation estimations as raster values allow for (taking into account the level of representativeness) an additional 25-30 raster precipitation values for the territory.
Analysis of the relationship between monthly precipitation totals determined via the weather stations and RS products reveal lower values of the determination coefficient (average of 0.52 and 0.56 for CHIRPS and GPM IMERG, respectively) than, for example, for the territory of the Cyprus (Retalis et al. 2018), where the corresponding GPM IMERG determination coefficient exceeds 0.9. A greater correlation can be induced by improving the information availability of precipitation gauge data, where the 3 Crimean WMO weather stations with free open access to data exhibited an almost 20% higher correlation than other regional stations.
Field rain gauges can aid in evaluating the accuracy of the estimated precipitation spatial distributions determined via the satellite data. However, the level of systematic error for these types of devices can reach 20-30% (WMO 2008; Villarini et al. 2008), due to the lack of metrological requirements. Moreover, in winter such simplified field rain gauges are removed from the fields. Small and automated weather stations (which often have a solar panel and batteries) have similar drawbacks. Precipitation data collected from such devices may be unavailable and have even higher errors than indicated earlier (WMO 2008) or extensive temporal shifts (via periods of negative temperatures, as well as ice/snow melting times).
The principle disadvantage of the satellite products considered in this work is the 1-1.5 months data lag on the CHIRPS monthly and 5-day precipitation totals and the 3-3.5 month lag on the GPM IMERG final calibrated data (final run). Although the GPM IMERG operational level of the precipitation estimations (early run) and intermediate data (late run) are available, the accuracy of these datasets (Fig. 3) does not allow for their direct application in monitoring tasks or for operational and technological decision making.
6. Conclusions
We compared the monthly precipitation totals obtained from the GPM_3IMERGM v06 and CHIRPS 2.0 products across period January 2017 – July 2020 with ground-based observations from weather stations located in the steppe region of Crimea. The following key conclusions were made.
The CHIRPS and GPM IMERG products demonstrated, on average, an overestimation of gauged monthly precipitation totals by 6.8 mm and 21.6 mm month-1 (22% and 71%). Furthermore, the average deviation of the precipitation determined from the WMO weather stations were 11% and 62%, with 30% and 77% for other regional weather stations, respectively.
The correlation coefficients between the measured monthly precipitation totals and estimations were determined as 0.75 and 0.73, for GPM IMERG (final run) and CHIRPS, respectively.
The average absolute deviations of the minimum RS estimated monthly precipitation totals from the ground-based observations were 2.3 and 7.6 mm for GPM IMERG and CHIRPS, respectively. This is comparable with the accuracy of the soil moisture content measured in the field under common practice in the Crimea that enables to neglect them in agrohydrological calculations.
The two products considered in this paper have distinct advantages and disadvantages based on their spatial and temporal resolution. Synthesizing the favorable features of each products can improve their quality indicators. For example, during a 3-month absence of the GPM IMERG final run data, the CHIRPS data can be employed for 2 months. However, for the last month, further verification and calibration of the daily GPM IMERG data is required for its subsequent application in operational agro-technological decisions.


