1. Introduction
Climate change has multiple environmental and economic effects; among them are impacts on water resources and, accordingly, the water supply for drinking and economic needs (agriculture, industries, etc.). By altering major aspects of hydrological regimes, climate change will pose additional challenges to water management. The warming climate is likely to lead to diminished water resources, thus making it difficult to maintain good ecological status in surface waters as prescribed by the Water Framework Directive.
Identifying the variability in water-flow features under current climatic conditions is necessary for (1) solving many scientific and practical issues of rational water resources use; (2) increasing the operational efficiency of water management facilities; and (3) monitoring polluted regions of Ukraine. Therefore, research into the dynamics of river discharges in different regions under the impact of climate change is one of the most urgent tasks for Ukrainian hydrologists.
The first scientific publication to address changes in the hydrological regime of waterbodies under the influence of climate change appeared in the 1980s (Nemec, Schaake 1982; Bultot et al. 1988; Fiering, Rogers 1989; Peterson, Keller 1990). Today, research into climate change impacts on water resources and stream-flow regimes is the focus of many scientists from various countries around the world. Leaders in the quantity of published scientific works are scientists from the USA and Canada (Schindler 2001; Whitfield 2001; Javelle et al. 2002; Barnett et al. 2004; Diemann, Eltahir 2005; Hodgkins, Dudley 2006; Schnorbus et al. 2022). They have considered the impacts of climate change on water balance characteristics, water resources, and discharge within individual river basins and countries as a whole, including the response of flow fluctuations to climate change scenarios.
This area of research is also well-represented by scientists from Europe, in particular from France (Kastendeuch 2007; Planton, Terrey 2007), Germany (Middelkoop et al. 2001; Menzel et al. 2002), Poland (Kuchar et al. 2014; Malinowski, Skoczko 2018), Hungary (Nováky, Bálint 2011), Czech Republic (Řenzničkova et al. 2007), Slovakia (Kohnová et al. 2019), Spain (Brunet et al. 2007), Italy (Confortola et al. 2013), and Scandinavian countries (Rodhe 1981; Krasovskaia, Gottschalk 2002; Andréasson et al. 2004; Phil Graham et al. 2007). Additional leading roles in research of hydrological characteristic changes under the influence of climate fluctuation are played by scientists from China, Japan, India, and other Asian countries (Islam et al. 2005; Devkota, Gyawali 2015; Nazari et al. 2016; Liu, Xu 2017; Dahri et al. 2021; Khatri, Pandey 2021; Al-Munqedhi et al. 2022; Grover et al. 2022; Xiang et al. 2022).
Unfortunately, in contrast to other countries, studies of the current hydrological regimes of rivers in Ukraine under the influence of climate change have not been conducted properly. The studies are pretty much incomplete and unsystematic; in most cases, only general characteristics of changes in selected hydrological parameters have been recorded.
In Ukraine, research into climate change impacts on the hydrological regimes of Ukrainian rivers is conducted by the scientists of National Taras Shevchenko University (Strutynska 2008; Chornomoretz, Hrebin 2010; Hrebin 2010). The probable changes in water resources in Ukraine under global warming conditions have been estimated by scientists of Odesa State Environmental University E. Hopchenko and N. Loboda (Loboda 2005; Hopchenko et al. 2010).
In the present study, the Horyn River basin was selected to represent the current changes in discharge (daily discharges) as well as changes in meteorological factors that influence discharge, such as air temperature and precipitation.
2. The study area
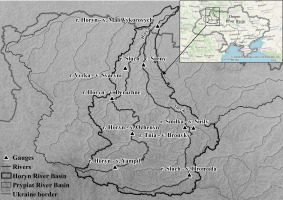
The Horyn River is located in the Pripyat River sub-basin of the Dnipro River Basin District; it is the largest right-bank tributary of the Pripyat River, passing through the territories of Ukraine and Belarus Republic (Fig. 1). The Horyn River is 659 km long, with a drainage basin of 27,791 km2. The maximum width is 80 m, and the maximum depth is 16 m. The source of the Horyn River is in the Ternopil Oblast of Ukraine, south of the city of Kremenets, and north of the administrative center of Ternopil Oblast, city of Ternopil. From there, the river flows north in a series of s-shaped bends through the Ukrainian oblasts of Khmelnytskyi and Rivne. Then the river flows northeast into the Belarusian oblast of Brest, where it finally confluences with the Pripyat River.
The source of the Horyn River is within the Kremenets Upland: the river flows at first through the Volyn Upland, mostly in a narrow valley with high, steep slopes; later on, the river flows through the Polisia Lowland in an extensive swampy floodplain, marked by channels and old riverbeds. Finally, on the lower section, it passes through the Pinsk swamps.
The main tributaries of the Horyn River are the rivers Sluch (catchment area 13,800 km2), Vilia (catchment area 1,815 km2), Stubla (catchment area 1,350 km2), and Ustya (catchment area 762 km2).
The river is nourished mainly by snow but with significant percentages of rain and groundwater.
Intra-annual flow is characterized by high spring floods, a summer low-flow period interrupted by short-term rain-induced floods, with rising water levels in autumn and winter.
The upper reaches of the river are used as a source of hydropower and for fishing. In general, the water resources of the basin are used for industrial, household, and agricultural water supply. The Horyn River is regulated by numerous reservoirs and ponds.
The Khmelnytska Nuclear Power Plant (NPP) is located in the upper section of the Horyn River. The NPP utilizes water from the Horyn River for cooling and reduces peak flood values, leaving only minimal runoff in the channel (Pripyat Basin Water Management Authority 2022).
3. Methodology and data
Data from nine water gauges (one of them is in Belarus) with 60 years of observations have been used to study changes in the water regime in the rivers of the Horyn River basin. Also, data from 17 meteorological stations (two in Belarus) has been used to study changes in air temperature and precipitation. The duration of meteorological observations is 60 years.
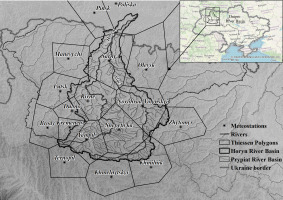
The location of water gauges and meteorological stations in the Horyn River catchment is shown in Figures 1 and 2.
To analyze the climate change impact on the water regime, influence areas in the river’s catchments (i.e., the areas assigned to each specific meteorological station) were delineated within the Horyn River basin, assessed by using ArcGIS.
The first step in analyzing climate change impacts on the water regime is to estimate the meteorological characteristics (precipitation, temperature, etc.) and their distribution within the river’s catchments. The network of meteorological stations provides values of climatic characteristics at specific points, so it was necessary to extrapolate the point values of meteorological parameters (daily precipitation and air temperature) over areas within specific catchments. Methods for converting point meteorological values at different meteorological stations into an average value over a catchment include arithmetical means, Thiessen polygons, the Isohyetal method, etc.
The Thiessen polygon method is a commonly used method for weighting observations from meteorological stations according to the area. This method is also called the weighted mean method and is considered the most important in engineering practice. The Thiessen method cannot account for topographical distributions of the parameters, but because the Horyn River basin lacks significant elevation differences, this method can be used.
The Thiessen polygons established the influence areas of specific meteorological stations relative to a separate catchment (Voronoi 1908; Thiessen 1911; Brassel, Reif 1979; Boots 1980, 1986). The weights of the meteorological stations are computed by their relative areas, which are estimated with the Thiessen polygon network. The polygons are formed by the perpendicular bisectors of the lines joining nearby stations. The area of each polygon is used to weigh the meteorological values of the station in the center of the polygon.
According to this method, the weight coefficients (k) are defined in order to obtain average precipitation and air temperature values for the studied catchments attributed to specific water gauges.
ArcGIS tools were used to divide the catchment into separate influence areas (weights) of each meteorological station within the gauged catchments (ArcToolbox > Analysis Tools > Proximity > Create Thiessen Polygons). The influence areas of each meteorological station on the water gauges within the Thiessen polygon were calculated according to the formula:
k = f1/F (1)
where, f1 = the influence area of the meteorological station that was calculated within the catchment area of the water gauges; F = the total catchment area of the water gauge.
The sum of the weight coefficients for each water gauge catchment should be equal to 1 (Table 1).
Table 1.
The weight coefficients of the meteorological stations for water gauge catchments within the Horyn River basin.
The next step was to calculate the amount of precipitation and air temperature based on the weighting coefficients for each water gauge catchment within the Horyn River basin, according to the formula:
P = P1 • k1 + P2 • k2 + ….. + Pn • kn (2)
where: P1, P2 … Pn = the precipitation amount or air temperature at the separate observation points (mm or ℃); k1, k2 … kn = values of the weighting coefficients at the separate observation point.
To assess the impact of climate change on discharge in the Horyn River basin, the residual mass curves were used to reveal regularities in the cyclical fluctuations of the runoff from the catchment. Correspondingly, with combined chronological graphs, the trend of changes in the long-term dynamics was identified. Trend analysis is one of the most commonly used tools for tracing changes in hydrological time series, such as water discharges, and for meteorological data, such as precipitation and air temperature.
Residual mass curves were used for identifying patterns in the cyclical fluctuations of the hydrometeoro-logical characteristics. For comparing results, the graphs of the long-term dynamics (combined chronological graphs) and the residual mass curves were created in the modulus coefficients (Ki) according to the following equation:
where: Ai – the value of i-element of the series;
To exclude scale effects, the residual mass curves were expressed as normalized deviations for comparison. The expression for the residual mass curves in modular coefficients assumes the following form:
where: f (i) – the ordinates for these curves; Ki – the modulus coefficients; Cv – the coefficient of variation.
The coefficient of variation (Cv) is a statistical measure of the dispersion of data points in a data series around the mean. The coefficient of variation represents the ratio of the standard deviation to the mean, and it is a useful statistic for comparing the degree of variation from one data series to another. Cv was calculated according to the following equation:
where n = the number of members in the series. s
Therefore, the residual mass curve represents the cumulative sum of the modular coefficients’ deviations from the mean annual values of the series for each Ai year.
The period for which the integral curve section slopes upward with respect to the horizontal line corresponds to the positive phase (increasing tendency) of fluctuations in the hydrometeorological characteristics. The period for which the integral curve section slopes downward with respect to the horizontal line corresponds to the negative phase (decreasing tendency) (Melnyk, Loboda 2020).
To identify changes in daily water discharges, air temperature, and precipitation in the Horyn River basin caused by climate change, two periods were selected: 1961-1990 and 1991-2020. The period from 1961 to 1990 has been adopted as a standard reference period for long-term climate change assessments, as recommended by WMO (WMO 2017).
4. Results
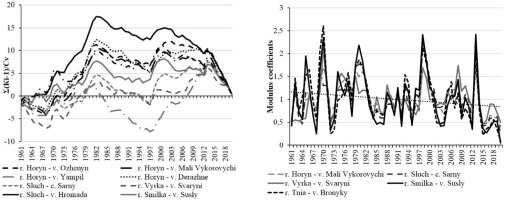
The residual mass curves and combined chronological graphs of runoff fluctuations at the water gauges of the Horyn River basin for the 1961-2020 period were constructed. The analysis of residual mass curves showed the synchronicity of discharge fluctuations at all water gauges. The low water phase has been observed since the 2000s at all water gauges. The trend line in the combined chronological graphs also indicates a decrease in discharge in the basin in the current period (Fig. 3).
Fig. 3.
The residual mass curves and the combined chronological graphs of the mean annual water discharges at water gauges in the Horyn River basin.
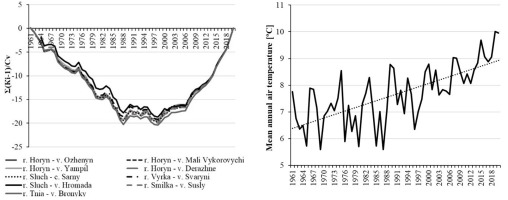
The decrease in air temperature can be clearly traced through 1988 according to the residual mass curves of long-term air temperature fluctuations; the current warming period is apparent, beginning in 1998.
The averaged combined chronological graph of air temperature fluctuations is characterized by an upward trend in the Horyn River basin (Fig. 4).
Fig. 4.
The residual mass curves and the combined chronological graphs of the mean annual air temperature at water gauges in the Horyn River basin.
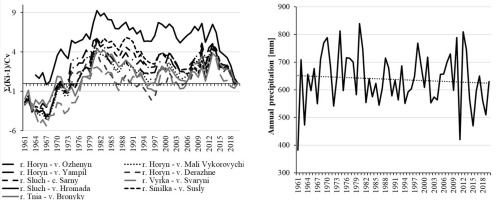
The analysis of long-term fluctuations of the annual precipitation showed that they are synchronous. Thus, there was an increase in precipitation before the 1980s, but precipitation has been decreasing since 2013 within the basin. Short-term phases of decrease or increase of precipitation with small-amplitude fluctuations have been observed in the Horyn River basin during the period of the 1980s-2000s. This conclusion is proved by the pattern in precipitation absolute values on the averaged combined chronological graph (Fig. 5).
Fig. 5.
The residual mass curves and combined chronological graphs of the annual precipitation at water gauges in the Horyn River basin.
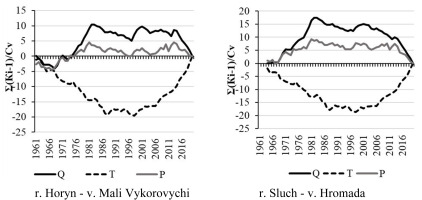
The complex residual mass curves were developed to show the dependence of discharge changes (mean annual water discharges) on meteorological factors (mean annual air temperature and annual precipitation) (Fig. 6). The graphs clearly show the synphase discharge and precipitation fluctuations, as well as their asynphase to fluctuations of the air temperature. Such trends were observed in all water gauges within the Horyn River basin.
Fig. 6.
The combined residual mass curves of the mean annual water discharges (Q), the mean annual air temperature (T), and the annual precipitation (P) at water gauges in the Horyn River basin.
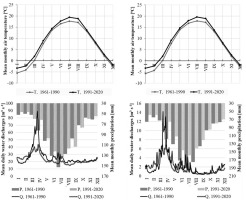
Combined graphs of the long-term mean monthly air temperature and precipitation and averaged hydro-graphs of the mean daily water discharges for two periods for all nine water gauges in the Horyn River basin were plotted to determine the changes in the discharge in the current period (1991-2020) in comparison with the period of the climatic norm (1961-1990) using precipitation and temperature analysis (Fig. 7).
Fig. 7.
Combined graphs of long-term mean monthly air temperature (T) and precipitation (P) and mean annual daily discharge (Q) hydrographs for two periods (1961-1990 and 1991-2020) at water gauges in the Horyn River basin.
Discharge
The analysis of discharge hydrographs for the periods 1961-1990 and 1991-2020 showed that flows have significantly decreased in the current period in the Horyn River basin (Fig. 7). Such changes are especially observed in the spring period, when the shape of the discharge hydrographs changed toward a flatter profile, without such high peak water discharges as in the period of the climatic norm. Thus, water discharges in the Horyn River basin decreased on average by 21% in spring, 15% in summer, and 13% in autumn. The most significant decrease in discharge compared to the period of climatic norm was observed in April, when it decreased on average by 30% within the basin. March and May are characterized by an average decrease in water discharges of 14%. The largest decrease in water content in the summer period occurred in July (by 22%). As for the autumn season, the largest decrease in water runoff (by 17%) in the Horyn River basin was observed in September and the least (by 8%) in October. In contrast to other seasons, water discharges in the winter period increased by an average of 8% within the basin. However, such changes are not observed throughout the season. Thus, the water discharges decreased by 12% in December, whereas the discharge in January and February increased by 10% and 24% compared to the period of the climatic norm (Fig. 7).
Precipitation
A decrease of precipitation by 8-9% was noted in winter, spring, and summer from 1991 to 2020 in the Horyn River basin (Fig. 7). Thus, precipitation in the winter period mostly decreased in January (by 14%), and the least in February (by 5%). Spring precipitation decreased by 27% on average in April in the Horyn River basin and increased by 11% in March. In summer, there is also less precipitation in the basin compared to the climatic norm. The largest changes were in June, when precipitation in the current period decreased by 12%, and the smallest changes were observed in July (by 6%). Precipitation increased in autumn by 4% compared to the climatic norm. For the autumn months, the greatest increase in precipitation was in October (by 6%), while the smallest was in September (by 2%).
Air temperature
Air temperature has been increasing throughout the year during the current period, ranging from 0.6℃ (autumn) to 1.6℃ (winter). For the study area, January has experienced the greatest warming in the current period (by 2.3℃), while October has warmed the least (by 0.5℃). The greatest temperature increase in spring and summer (by 1.8℃) was observed in March and July (Fig. 7).
In summary, within the Horyn River basin, the discharge decreased by 13%; the precipitation by 6%; and the annual average air temperature increased by 1.3℃ in comparison with the WMO climatic norm (1961-1990).
The analysis of combined graphs of air temperature and precipitation and discharge hydrographs in rivers of the Horyn River basin has shown that the water discharges of spring floods significantly decreased with the simultaneous increase of water discharges in the winter low-water period over the past thirty years. We assume that such a decrease in the spring flood in the Horyn River basin could be explained by the increasing air temperature throughout the basin, especially during the winter period. This led to decreases in the soil freezing depth, causing, in combination with frequent thaws in winter, decreases in water equivalents of the snow cover. Our findings are supported by other studies (Hrebin, Vasylenko 2012).
Despite the precipitation increases in the autumn period, the decrease of discharge in this period probably can be explained by the air temperature increasing, which leads to increased evaporation from the water surface and increased infiltration processes in autumn.
The discharge decrease in summer, as observed in the current period (1991-2020) in the Horyn River basin, is attributable to increasing air temperature and a decrease in the precipitation that forms rain floods in this period.
5. Conclusion
The analysis of daily air temperature and precipitation reflects the negative impact of climate change on the discharge in the Horyn River basin over the past 30 years. Thus, since the 2000s, there has been a transition from the high- to low-water phase of the hydrological cycle for all rivers of the basin, which continues to the present.
Since the end of the 1990s, the air temperature increase was noted at all water gauges of the Horyn River basin. Since the 2010s, there has been a clear decrease in precipitation in the basin.
Despite the fact that over the past 30 years, precipitation has increased in March, the flow of the spring period has decreased by almost half. This phenomenon can be attributed to increasing air temperature in the winter period, frequent thaws, and, consequently, to the decrease in the water equivalent of snow cover, which plays a major role in nourishment of the rivers of the basin and forms the greater part of the annual runoff during the spring flood period. On the other hand, these factors have led to increasing discharge during the winter low-water period.
The influence of climatic factors on the water runoff of the summer and autumn periods also caused decreased water storage during these seasons in the current period.
These findings should be useful for the rational management and appropriate use of water resources under climate change conditions in the Horyn River basin, as well as for updating the regulations of the Khmelnytska NPP exploitation, which is located within the studied basin. The approaches used in this paper can be applied to the study of other river basins with similar conditions of flow formation.

