1. Introduction
Our Earth is covered by 30% solid land and 70% water. Of the total water content on Earth, 97% is saline water in oceans and seas. The remaining 3% is freshwater, out of which almost 2% is in the form of glaciers and polar ice caps; and the remaining 1% is above ground (streams, lakes, rivers, etc.). Moreover, the fraction of fresh water available for human consumption is only 0.01% (Sherani 2020). In Earth’s atmosphere and hydrosphere systems, one of the important phenomena is the continuous circulation of water, which is commonly referred to as the hydrological cycle. The hydrological cycle, or water cycle, is the sum of all processes in which water moves from the land and ocean surfaces to the atmosphere and then back toward the Earth’s surface in the form of precipitation. Thus, the hydrological cycle is Earth’s water recycling system (Graham et al. 2010).
Generally, in the hydrological cycle, water evaporation from the land and ocean surface is about 496,000 cubic km annually; residence time in the atmosphere is about 10 days before precipitating as either rain or snow (Eki 2017). Half of the total solar radiation received at Earth’s surface is expended to evaporate water. Furthermore, one-third of the precipitation falling on land runs off into the oceans (Britannica 2020). Direct groundwater discharge to the oceans accounts for only 0.6% of the total discharge, and only a small proportion of precipitation is stored in rivers and lakes. The remaining precipitation over land (73,000 km3/y)returns to the atmosphere by evaporation (Britannica 2020). Various studies have revealed that the evaporation process by which water changes from a liquid to a gas from seas, oceans, and other water bodies like rivers, lakes, and streams provides nearly 90% of the moisture in our atmosphere. In addition, the remaining 10% in the atmosphere is released by plants through transpiration. A very small proportion of water vapor enters the atmosphere via the process of sublimation (in which water changes directly from solid snow or ice into a gas) (Graham et al. 2010).
Another process in the water cycle is known as condensation, in which water vapor is transformed into the liquid state (Graham et al. 2010). Water vapor is the primary form of atmospheric moisture in the troposphere at altitudes of 10-13 km. Furthermore, water vapor is very important as a supply of moisture for frost, fog, dew, clouds, and precipitation (Li et al. 2020). Condensation is rapid when air contains more water vapor than it receives from evaporation at the prevailing temperature. This condition occurs due to two phenomena: either cooling or the mixing of air masses of different temperatures. As the condensation process completes, the water vapor in the atmosphere is released in the form of precipitation (the last phase of the water cycle) (Britannica 2020). Through a review of relevant literature, this paper focuses on highlighting the acceleration or intensification of the hydrological cycle around the globe, along with describing its overall potential impact on water availability.
2. Methodology
This study encompasses analysis based on a literature review regarding the topic of hydrological cycle acceleration and water availability over land. Various research papers were searched and reviewed, from research databases like PubMed, Research, Web of Science, JSTOR, ScienceDirect, ResearchGate, etc. Data were also obtained from US-EPA sites. The topic was examined with the help of various studies that have been conducted in various regions around the globe.
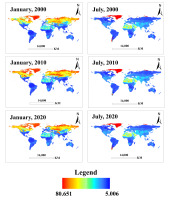
For the satellite remote sensing analysis in this study, raster data (in NetCDF format) of rain precipitation rate were obtained from the Global Land Data Assimilation System (GLDAS) of the National Aeronautics and Space Administration (NASA). The specific dataset was GLDAS Land Surface Model L4 Monthly 1.0 x 1.0 degree V2.1 (Rodell et al. 2004; Beaudoing, Rodell 2020). Subsequently, ArcGIS 10.8 software was used to make maps (depicting 6 continents) of 6 different months (January and July of 2000, 2010, and 2020; see Fig. 4). Shapefiles were retrieved from the online database; thus, the coordinate system is not represented in the maps. The midrange formula, derived from the study of Can and Ozsoy (2023), was calculated via spreadsheet from the aforementioned rainfall rate data to analyze the data:
3. Results
3.1. Acceleration of the hydrological cycle
The earth’s climate has not remained constant. Instead, it has been evolving over millennia. Isotopic studies of ice cores show that there has been a variety of variations and responses induced by different components of the earth system (Farooqi et al. 2005). Moreover, rapid variations in Earth’s climate have also occurred due to anthropogenic activities. For instance, since the Industrial Era (beginning in 1750), the concentrations and emissions of greenhouse gases (GHGs) have been increased. This dynamic has strongly affected climatic processes and caused prominent changes in Earth’s climate (Allen, Ingram 2002; Ciais et al. 2013).
Consequently, the global hydrological cycle is accelerating and intensifying due to global warming and climate change; resulting in increased evaporation, evapotranspiration, water vapor content, and precipitation (Huntington 2005). In addition, human activities are also contributing to the acceleration of the hydrological cycle by increasing loads of sulfate, mineral dust, and black carbon aerosols in the atmosphere that have the potential to affect the hydrological cycle in two ways; one is through the suppression of rainfall in polluted areas, and the other is through reducing the solar irradiance reaching the Earth’s surface (Wild et al. 2004). The mechanisms of both these effects originate primarily when aerosols increase the concentrations of cloud condensation nuclei, reduce the mean size of cloud droplets, and finally result in less efficient coalescence into raindrops (Ramanathan et al. 2001). Secondly, these aerosols reduce the surface solar irradiance, thus reducing surface evaporation and precipitation (Huntington 2005).
Hydrological cycle acceleration increases the frequency and intensity of extreme events, such as heavy rainfall, major storms, ocean salinity, and droughts, and ultimately increases the rate of soil erosion (Loaciga et al. 1996; Held, Soden 2000; Chagas et al. 2022). Several impacts on agriculture (heat stress, diseases, nutrient cycling, and insects) are related to high evaporation rates from soil and plants (Huntington 2005). A very dynamic aspect of hydrological cycle acceleration is the more frequent occurrence of extreme events, an alarming threat to human populations. These drastic events affect human welfare directly through catastrophic damage and indirectly through adverse effects on overall crop productivity (Arnell et al. 2001; Manabe et al. 2004).
3.1.1. Acceleration of evaporation
As mentioned above, the major process in the water cycle is the process of evaporation. In this phase, water in the liquid state is transformed into vapor or gas (Graham et al. 2010). The transformation occurs when some molecules in a water mass have attained sufficient kinetic energy to eject themselves from the water’s surface.
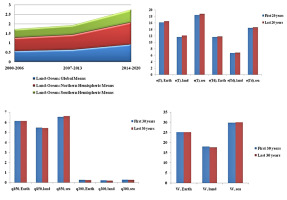
There is a multitude of factors that affect the evaporation rate in the water cycle; they include humidity, temperature, wind speed, and, most importantly, solar radiation (Britannica 2020). Simulations based on one of about 20 coupled models (ocean–atmosphere–land models) estimated that global mean evaporation will experience an increase of about 5.2% by 2050, which is a clear sign of the acceleration of the water cycle (Wetherald, Manabe 2002). Figure 1 represents the changes in meteorological parameters that have occurred in the past few decades around the globe.
Fig. 1.
(a) Global and Hemispheric Monthly Means and Zonal Annual Means based on Land-Ocean Temperature Index or L-OTI (Data source: Lenssen et al. 2019; GISTEMP Team 2023); (b) Water vapor pressures e(T) and e(Td) (Data source: Koutsoyiannis 2020); (c) Specific humidity at 850 hPa and 300 hPa (Data source: Koutsoyiannis 2020); (d) Water vapor amount (Data source: Koutsoyiannis 2020).
3.1.2. Acceleration of precipitation
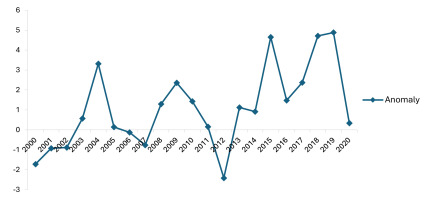
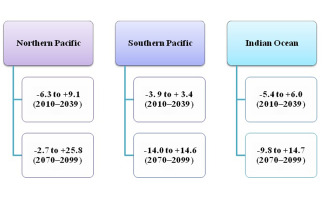
With the help of precipitation, some amount of water is returned to the atmosphere by evaporation, some is evaporated from the plants by transpiration, some percolates into the soil or ground via infiltration (which may later percolate into streams as groundwater runoff), and the remaining proportion flows directly as surface runoff into the sea (Graham et al. 2010). However, disturbances of all these phenomena related to precipitation are occurring due to the intensification of the water cycle. In this regard, recent modeling studies suggest that due to increased humidity, precipitation would increase by about 3.4% per degree Kelvin. That amount is less than is suggested by the Clausius–Clapyeron relation model that indicates precipitation would increase by about 6.5% because evaporation would be energy-limited as the evapotranspiration rate increases with the rising temperature (Huntington 2005). For instance, Figure 2 shows the precipitation trend (by USEPA) in the contiguous 48 states of the USA from 1960 to 2020, revealing that these states have been experiencing precipitation increase and hydrological cycle acceleration throughout these years. Moreover, based on climatic changes, changes in the precipitation over small islands have also been estimated (Fig. 3).
Based on the midrange calculation, rainfall rates were 43.096 kg m-2 s-1 in January 2000, increasing to 43.902 kg m-2 s-1 in January 2010 (hence representing the changes in the hydrological cycle). The opposite trend was shown for July; midrange values were 42.724 kg m-2 s-1 (2000), 42.543 kg m-2 s-1 (2010), and 42.05 kg m-2 s-1 (2020). These patterns demonstrate that the hydrological cycle has been experiencing changes throughout the world, with either less rainfall and more evaporation or more rainfall and less evaporation. In 2020 (during January), in contrast to 2000 and 2010, the high rainfall rates in areas of Asia near India expanded. Moreover, as compared to 2000 and 2010, the South American region receiving a high rainfall rate expanded in July 2020.
3.2. Evidence from some studies related to acceleration of the hydrological cycle
Following is a brief overview of some studies that can be attributed as evidence of hydrological cycle acceleration. These three studies represent examples of hydrological cycle intensification from three different continents of the world (Asia, North America, and South America).
CHINA
A study indicated an upsurge in precipitation in the regions of Xinjiang, in northwestern China, during 1986-2003. This increasing precipitation was associated with significant warming that occurred during this period, which revealed that the hydrological cycle in Xinjiang region had accelerated. Moreover, it was also found that a significant correlation was present between precipitation and altitude in parts of Xinxiang (including Altay, Tacheng, Tianshan southern slope, Kunlun northern slope, Ili, etc.). At higher altitude stations, there was abundant precipitation (Feng, Wu 2016).
USA
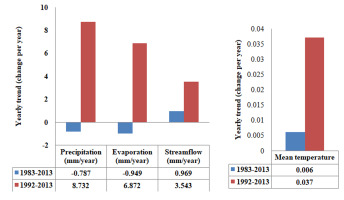
A study in Illinois (midwestern USA) evaluated the acceleration of the terrestrial hydrological cycle over 31 years (1983-2013). The variables that were observed in the study were precipitation, temperature, stream flow, soil moisture, evaporation, and groundwater level. The results showed increasing trends of 8.73 to 9.05 mm/year in precipitation, 6.87 to 7.47 mm/year in evaporation, and 1.57 to 3.54 mm/year in stream flow. Plus, these increasing trends were concurrent with the increasing temperature trend of 0.029 to 0.037°C/year. Consequently, this study provided evidence for the amplification or acceleration of the hydrological cycle as a response to warming in the midwestern USA. Based on the results of this study, Figure 5 depicts the precipitation, evaporation, stream flow, and mean temperature in Illinois (USA) in 1983-2013 and 1992-2013, which portrays an increase in the variables of precipitation, evaporation, and stream flow along with the rise in temperate. Thus, it represents the intensification of the water cycle (Yeh, Wu 2018).
Fig. 5.
Yearly trends in precipitation, evaporation, and stream flow (left) and mean temperature (right) in Illinois, USA. Data source: Yeh, Wu (2018).
BRAZIL
A study incorporated data from 886 hydrometric stations to examine the acceleration of the hydrological cycle in Brazil from 1980 to 2015. Annual time series of minimum 7-day, mean daily, and maximum daily stream-flow were computed to characterize drought flows, water availability, and flood flows, respectively. The relationships of streamflow changes to their climatic and non-climatic drivers were analyzed by panel regressions. The results represented the acceleration of the hydrological cycle over Southern Amazonia. Specifically in southwestern Amazonia, prolongation of the dry season was found to be connected to a northward shift of the Inter Tropical Conversion Zone (ITCZ), which resulted in increased temperature and evaporation. Moreover, increases in heavy precipitation and floods were found to be linked to the intensification of Walker circulation air masses. Overall, it was found that the acceleration (in terms of more intense and frequent floods and droughts) occurred in over 29% of the Brazilian region and was connected to heavier rainfall (Chagas et al. 2022).
3.3. Effect of acceleration of the hydrological cycle on water availability
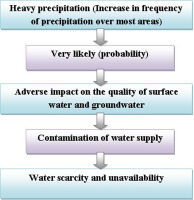
As mentioned previously, global warming is associated with acceleration and alteration of the hydrological cycle. This acceleration has the potential to affect and change the availability of water resources (Bates et al. 2008). Any abnormal changes or alterations in Earth’s climate result in adverse impacts on human beings (Thomas et al. 2014). As the normal water cycle is disturbed due to global warming and climate change, the surface temperature is increased, and the evaporation rate is disturbed (IPCC 2001; NAST 2001). Increased evaporation rates are expected to reduce water supplies in many regions of the globe. Global water resources are highly sensitive to temperatures, not only through the obvious effects of evaporation, but also because of the effects on rainfall distribution, convection, and wind patterns (IPCC 2008). Variations in evaporation and precipitation patterns due to extreme climate change will elevate water usage to meet human needs, thus fundamentally changing the availability, quality, and timing of water across the globe. Disturbance in the normal water cycle due to climate change results in disturbance in water availability (by reducing supplies of ground-water and surface water), increasing water demand (due to higher temperatures), degrading water quality (in-creasing runoff resulting in erosion and sedimentation) and overwhelmed water infrastructure (due to flooding). Precipitation is expected to occur more frequently through high-intensity rainfall events, causing increased runoff and erosion (Huntington 2005).
However, the acceleration of the water cycle is not only negative. Instead, it can affect water availability over land in two different ways; either increasing water availability (decreased water stress), or it can decrease water availability (increased water stress). According to SRES (Special Report Emissions Scenarios by IPCC) scenarios (A2 and B2) along with two climate models, water stress will decrease over 20-29% of global land by the 2050s (Bates et al. 2008). In contrast, water stress is projected to increase over 62-76% of global land over the same period. The increase in water availability in a few regions is associated with the upsurge in the frequency and intensity of precipitation. On the other hand, the projected decrease in water availability in most regions of the world is associated with increasing water withdrawals (Bates et al. 2008).
3.3.1. Increase in water availability due to acceleration of the hydrological cycle
As mentioned previously, hydrological changes (including acceleration of the hydrological cycle) can have positive impacts in terms of water availability. For instance, intensification of precipitation leads to an upsurge in annual runoff, which further increases renewable water resources (if the water is captured and stored in the waterbodies) (Magrin et al. 2005). In regions of the world with adequate infrastructure, this stored water can be beneficial for irrigation. Southern South America is an example, where the flooded area has increased, and crop yields have improved in the Pampas region of Argentina. The increase in flooded land has also provided new opportunities for fishing in the area (Magrin et al. 2005).
3.3.2. Decrease in water availability due to acceleration of the hydrological cycle
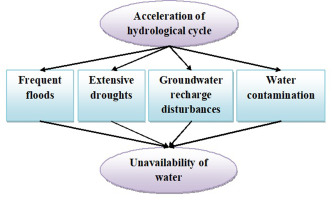
Overall, the climate-related projections indicate that the more prevalent impact of intensification of the water cycle will be adverse in the context of decreasing water availability (Bates et al. 2008). For instance, a study conducted in the Llobregat River Basin in Catalonia, northeastern Spain, evaluated the relationships between climate change scenarios and impacts on water availability in the region. Climate change scenarios and hydro-logical modeling were combined to estimate water availability in the future. AEMET (The Agencia Estatal de Meteorologia) and SMC (The Meteorological Service of Catalonia), the Spanish weather agencies, provided the data for climate projections. The results based on AEMET climate scenarios indicated that there would be a decrease of 10% in the annual volume of water available in the future. The results obtained based on SMC scenarios were even more daunting because they revealed the possibility of a 40% decrease in the annual volume of water available in the future due to climate changes (Versini et al. 2016). Figure 6 depicts those factors of the hydrological cycle’s acceleration that adversely influence water availability over land.
3.3.3. Frequent floods
The acceleration of the water cycle has the potential to increase floods. In the 21st century, it is projected that the events of heavy precipitation or intense rainfalls will become more frequent in most of the regions around the globe. This dynamic will eventually result in frequent events of flash flooding (Bates et al. 2008). Moreover, the results of a study based on multi-model analysis projected an upsurge in the risk of very wet winters in central and northern Europe. The reason for this is the intensification of precipitation. For example, it is projected that boreal winter precipitation is prone to increase about five- to seven-fold with likely winter flood hazards. It is also projected that the wet monsoon season will be prolonged and more intense in Asian regions (Palmer, Räisänen 2002). For instance, according to climate models, along with a 2°C rise in global temperature, the flooded area of Bangladesh will increase by 23-29% (Mirza 2003). It is also projected that a traditionally 100-year flood will return more frequently (every 2-5 years) (Zhang et al. 2003). These scenarios of frequent flash floods are mainly negative for those regions of the world that lack the proper infrastructure for water storage. Therefore, such regions are expected to face declining water availability despite experiencing frequent precipitation. Intense floods and runoff often do not fill or recharge water reservoirs, and ultimately the discharge mixes with oceanic water, making it unavailable for use – another negative influence on water availability (Bates et al. 2008). It is estimated that 913 floods have occurred in the world just in the span of 2000-2018, and about 300 million people have been affected by 21st-century floods (Cavallito 2021).
Furthermore, it is crucial to understand flood frequency analysis, because flood frequency indicates the probability of floods occurring at a regional scale in both gauged and ungauged catchments. Flood frequency analysis also helps to assess the risks associated with floods, and to plan appropriate flood mitigation measures. For instance, some studies have used statistical methods for the estimation of flood frequency based on historical data (Acharya, Joshi 2020; Samantaray, Sahoo 2020). These studies provide a clear understanding of flood dynamics in diverse geographical regions. Hence, they provide clarity regarding the intensity and variability of flood incidences from small to larger scales.
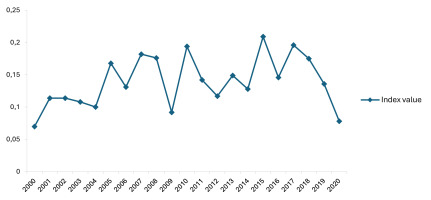
Figure 7 represents the statistics given by the US-EPA about the one-day extreme/heavy precipitation events in the contiguous 48 states of the USA from 1960 to 2020. First of all this index shows that 2000-2010 and 2010-2020 decades had prominent difference in terms of precipitation. Secondly, it represents that 2015 was the year when the precipitation in USA was maximum as compared to the rest of the included years.
Fig. 7.
Extreme One-Day Precipitation Events in the Contiguous 48 States of USA (1960-2020). Data source: USA-EPA (2021a).
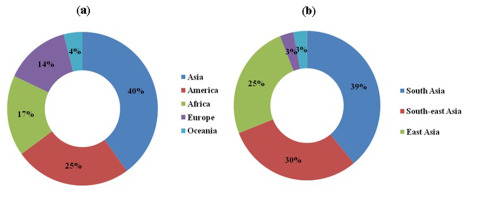
From the analysis of the flood events from 1973 to 2002, it was found that the proportion of floods among all disasters was 33%. During this time frame, most of the floods (40%) occurred in Asian countries. Moreover, within Asia, most of the flood events occurred in South Asia (Fig. 8) (Dutta, Herath 2004).
Fig. 8.
(a) Flood percentages in the world. (b) Flood percentages in different regions of Asia, Data source: Dutta, Herath (2004).
3.3.4. Disturbance of water quality
Increases in precipitation intensity are expected to cause many forms of water pollution. These include the amplification of nutrients, sediments, salt, dissolved organic carbon, pesticides, pathogens, and thermal pollution. There will be concomitant increases in algal blooms and fungal content in water (Bates et al. 2008). The increased precipitation has the potential to elevate turbidity levels in surface-water sources. For example, heavy precipitation events raised turbidity levels up to a factor of 100 in some of the main reservoirs of New York City, compromising the city’s water resources (Miller, Yates 2006). The quality of water is also degraded by flood water because the flowing flood water (having sediments and contaminants) gets mixed with the clean water of existing reservoirs. Additionally, with increased evapotranspiration, shallow groundwater is prone to salinization in semi-arid and arid areas. Plus, due to decreasing streamflow in semi-arid areas, there is a strong probability of increases in the salinity of rivers and estuaries. For instance, in the headwaters of Australia’s Murray-Darling Basin, salinity levels are projected to rise by 13-19% by 2050 (Pittock 2003). Increasing salinity will be accompanied by increasing concentrations of pollutants, such as those mentioned previously, making the water unsuitable for human uses, ultimately decreasing the availability of clean and safe water (Fig. 9) (Bates et al. 2008).
3.3.5. Extensive droughts
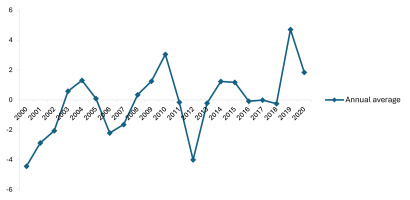
On one hand, intense evaporation causes heavy precipitation and floods in some regions of the world. On the other hand, this rapid evaporation makes some regions dry and causes prolonged droughts (Bates et al. 2008). Based on a single-model study of the frequency of drought around the globe, it is projected through various models that the frequency and duration of droughts will increase in the coming decades in many regions of the world. In this regard, the SRES A2 scenario has projected that by the decade of 2090, there will be an increase of 10-30-fold in land experiencing extreme drought, and a 2-fold increase in global drought frequency and mean duration of drought (Burke et al. 2006). It is also projected that by the 2070s, a 100-year drought under today’s conditions will return more frequently (10 years) in various countries, including France, Spain, Portugal, Poland, and Turkey (Lehner et al. 2005). These statistics make it clear that areas that are already facing or will face prolonged drought conditions will ultimately face the issue of lacking available water (Bates et al. 2008). Figure 10 represents the statistical analysis by the US-EPA of drought in the contiguous 48 states of the USA from 1960 to 2020.
Fig. 10.
Average Drought Conditions in the Contiguous 48 States of USA (1960-2020). Data source: US-EPA (2021c).
Prominent floods have been occurring in Central Europe, South Asia, East Asia, Africa, Oceania and South America (You et al. 2016; Ansah et al. 2020; Chhetri et al. 2020; Mu et al. 2020; Nanditha et al. 2023). Meanwhile, extensive droughts have been taking place in various regions around the world, including Central Asia, South Asia, North America, Oceania, South America, and Africa (Schwalm et al. 2012; Nicholson 2014; Yuan et al. 2018; Garreaud et al. 2020; Tan et al. 2022). Moreover, water contamination, including reduction of dissolved oxygen(DO), rise in temperature, and increase in phosphorus, pathogen contamination, etc., exacerbates water scarcity in the water resources of various regions of the world (Li et al. 2015; Carpenter et al. 2018; Shih et al. 2021; Zhu et al. 2021). The impacts of hydrological cycle acceleration on water availability have been observed and analyzed by many researchers around the world; instances of which are mentioned in Table 1.
Table 1.
Instances of impacts of hydrological cycle acceleration.
| Time | Region | Published sources |
|---|---|---|
| Flood events (caused by heavy rainfall) | ||
| 2000 | South Africa | Dyson, Heerden (2001) |
| 2002 | Central Europe (including Austria, Germany andthe Czech Republic) | Ulbrich et al. (2003) |
| 2005 | Mumbai, Chennai andBangalore (India) | Guhathakurta et al. (2011) |
| 2002, 2004 and 2007 | South Wales, Boscastle andTewkesbury,respectively (Britain) | Gavin et al. (2011) |
| 2010-2013 | Australia | Butler et al. (2015) |
| 2010-2014 | Pakistan | Rehman et al. (2015) |
| 2014 | South Korea | You et al. (2016) |
| 2016 | Hue (Vietnam) | Mu et al. (2020) |
| 2016 and 2017 | Nepal | Chhetri et al. (2020) |
| 2015 and 2018 | Ghana | Ansah et al. (2020) |
| 2018 | Ordu province (Turkey) | Kocaman et al. (2020) |
| 2020 | Palermo (Italy) | Francipane et al. (2021) |
| 2021 | Brazil | Marengo et al. (2023) |
| 2021 | Germany | Fekete, Sandholz (2021) |
| 2022 | Pakistan | Iqbal et al. (2022); Nanditha et al. (2023) |
| Drought events | ||
| 1999-2003 | Central Asia, Pakistan andChina | Zhang, Zhou (2015); Barlow et al. (2016) |
| 2000-2002 | Balkans, Greece andCyprus | Pashiardis (2008) |
| 2003 | Various European regions | Rebetez et al. (2006) |
| 2000-2004 | Western U.S. andCanada | Woodhouse et al. (2010); Schwalm et al. (2012) |
| 2002-2006 | Congo river basin andTropical Africa | Zhou et al. (2014) |
| 2004-2010 | Southwestern China | Yang et al. (2012) |
| 2006-2007 | USA andCanada | Basara et al. (2013) |
| 2006-2010 | Southern Australia | Van Dijk et al. (2013) |
| 2008-2010 | Argentina andChile | Müller et al. (2014) |
| 2008-2010 | Horn of Africa (or Somali Peninsula) | Masih et al. (2014); Nicholson (2014) |
| 2008-2010 | Middle-East, India andCentral Asia | Neena et al. (2011); Cook et al. (2016) |
| 2013-2016 | East Australia | Spinoni et al. (2019) |
| 2015-2016 | South Africa | Yuan et al. (2018) |
| 2015-2016 | Amazonia | Jiménez-Muñoz et al. (2016); Erfanian et al. (2017) |
| 2010-2018 | Chile | Garreaud et al. (2020) |
| 2011-2019 | Brazil | Cunha et al. (2019) |
| 2020 | Southeastern China | Tan et al. (2022) |
| Water contamination (due to heavy precipitation) | ||
| Production of high dissolved oxygen (DO) with low phytoplankton con-centration (in 2011) andrise in tem-perature and formation of cyano-bacterial blooms (in 2013) in Shib-ianyu Reservoir | China | Li et al. (2015) |
| Increase in phosphorus in agricul-tural watersheds | Upper Midwestern USA | Carpenter et al. (2018) |
| Increase in emerging contaminants in surface water | Mid-Atlantic USA | Zhu et al. (2021) |
| Pathogen contamination of Puzi River | Taiwan | Shih et al. (2021) |
| Increase in E.coli level in drinking water | Rural Kenya | Powers et al. (2023) |
3.3.6. Disturbances in groundwater reservoirs
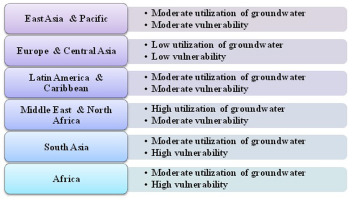
Groundwater is almost 30% of global freshwater, which means that it has a large share of the water usable for human beings. Moreover, the most accessible groundwater is found within 1 km of the surface of the Earth. Groundwater availability and quality decrease below this depth due to high concentrations of minerals (Brands et al. 2016). A very valuable attribute of groundwater aquifers is that they can store water without evaporation losses and in stable condition. Moreover, as water percolates through the ground and soil, the groundwater becomes de-contaminated (Turral et al. 2011). Almost 24% of the world’s groundwater aquifers are already over-exploited, indicating that any further disturbance in groundwater zones will significantly decrease fresh water’s availability (Gleeson et al. 2012).
Disturbance and acceleration in the hydrological cycle have adverse impacts on the depth of the groundwater table and recharge rates (Fig. 11). Because many groundwater reservoirs are recharged from precipitation and surface water flow, any change in these processes eventually affects groundwater (Bates et al. 2008). One of the main reasons for the adverse impact on the amount of groundwater is that rainfall has become more flashy (intense) and less predictable in many areas of the world (Brands et al. 2016). Therefore, according to the aforementioned phenomenon of precipitation increase resulting from acceleration of the water cycle, the upsurge in the intensification of rainfall affects the infiltration capacity of the soil, which eventually decreases the groundwater recharge (Bates et al. 2008). However, this is mostly happening in humid areas. In arid and semi-arid regions of the world, on the other hand, more intense rainfall causes fast infiltration and percolation through the ground before evaporating. Plus, alluvial aquifers are mostly recharged by the overflows of floods. Overall, it can be observed that the acceleration of the water cycle that affects groundwater reservoirs in any form ultimately disturbs the very important resources of fresh water present on Earth. Hence, any influence on groundwater influences overall water availability (Bates et al. 2008).
4. Discussion and conclusion
Human beings are witnessing a lot of climatic changes around the globe, and intensification or acceleration of the hydrological cycle is one of these changes. It is a fact that global warming (parallel to global average temperature) has been escalating, which in turn increases evaporation and precipitation rates, leading to acceleration of the hydrological cycle. The Clausius–Clapyeron relation suggests that as the temperature increases, the specific humidity should also increase. As the source of the circulation of water from the hydrosphere to the atmosphere and vice versa, it is obvious that any alteration in the hydrological cycle will ultimately influence the water availability over land.
Intense precipitation, rapid evaporation, frequent floods, extensive droughts, and water contamination are some of the prominent outcomes of this accelerating cycle. Even though acceleration of the water cycle is associated with an increase in the amount of available water (mainly by frequent precipitation) in many regions of the world, the risk of water unavailability from acceleration remains an adverse result in other regions. Moreover, the impacts of hydrological cycle intensification extend beyond the direct or immediate concerns of water availability. The alterations in the precipitation patterns have disturbed water quality; ultimately affecting agricultural productivity, ecosystems’ well-being, and human health. For example, increased runoff due to heavy precipitation or frequent floods carries pollutants into water bodies.
In a nutshell, human beings need to mitigate and adapt to the root cause of the intensification of this cycle (i.e., global warming) to protect themselves from the associated adversities. Adapting to the abovementioned issues needs interdisciplinary approaches that involve multiple domains (such as hydrology, ecology, climatology, and socio-economic factors). Helpful strategies in this regard include enhancement of infrastructure resilience, implementation of water-saving technologies, and promotion of sustainable land use planning. International cooperation is also crucial in this context. The vulnerable developing and under-developed countries that are facing issues related to the water cycle and climate changes, must be supported by the developed nations.

