1. Introduction
Floods can have a devastating impact on any region where they occur. Nonetheless, the frequency and severity of these events have increased significantly due to climate change in recent years (Waseem, Rana 2023).
In Brazil, it is estimated that there are approximately 3,000 km2 of areas prone to extreme weather events. At least 825 municipalities are considered highly vulnerable to disasters such as landslides and flash floods (Alvalá et al. 2019; Dias et al. 2020). Floods are the most common type of natural disaster worldwide and pose substantial risks to populations (Mishra et al. 2022).
Floods caused by heavy rains have had a drastic impact on the municipalities in the state of Maranhão, located in the northeastern region of Brazil, as indicated by official decrees issued by the Municipal Governments of Açailândia, Arame, Buriticupu, and Santa Luzia (Diário Oficial 2023a, 2023b, 2023c, 2023d).
Some recent research employs boxplots to identify anomalies in precipitation time series (Gogien et al. 2023; Moreira et al. 2023); stage-discharge curves to describe the behavior of rivers (Vishwakarma et al. 2023); flow duration curves (FDC) for optimized water resources management (Ridolfi et al. 2020); and the Mann-Kendall test for detecting trends in rainfall time series (Penereiro et al. 2018; Zhang et al. 2022).
The investigation of intense rainfall phenomena associated with flooding can be conducted through predictive models and proper hydrological data collection (Lima et al. 2019, Lima, Scofield 2021; Alves et al. 2022). In this study, all these tools were combined to develop a probabilistic model that estimates the likelihood of new flood events occurring in four municipalities in Maranhão: Açailândia, Arame, Buriticupu, and Santa Luzia.
2. Material and methods
2.1. Description of the study area
The study area encompasses the municipalities of Açailândia (5806 km2), Arame (2976 km2), Buriticupu (2545 km2), and Santa Luzia (5462 km2), in the state of Maranhão, in northeastern Brazil. These municipalities are in a state of emergency because of extreme precipitation events, as reported by the Ministry of Social Development (Brasil 2023). In the research reported here, hydrological time series data were investigated to develop a probabilistic model for predicting the occurrence of new flood events using data from the National Water and Sanitation Agency (Agência Nacional de Águas e Saneamento Básico – ANA). Figure 1 displays the municipalities and the selected hydrological stations.
The selection of stations was based on data availability in the Hydrological Information System (HIDROWEB). If the downloaded file contained data, the sample's consistency was verified through precipitation graphs (mm/day) over time. The goal was to identify the time interval during which the data were available and suitable for analysis; any station that did not provide valid data was discarded. Table 1 presents the stations that met this criterion and were selected for further investigation.
Table 1.
Overview of selected hydrological stations.
2.2. Boxplot
The box plot is an effective graphical tool for detecting atypical precipitation events. It displays the data distribution and allows for the visual identification of outlier values that represent exceptionally high or low precipitation events. The construction of boxplots in this study involved the calculation of several measures.
The median (Quartile 2) is the value that divides the data set in half as follows:
where n – total number of observations.
In addition to Q2, Q1 (Quartil 1) and Q3 (Quartil 3) are also required:
The interquartile range (IQR) is used to determine the whiskers in the boxplots, calculated as follows:
lQR = Q3 − Q1 (4)
Rainfall values beyond the boundaries represent the outliers. After plotting the graph, the coincidence of these points with flooding events in the municipalities of Maranhão was verified.
2.3. Stage-discharge rating curve
Stage-discharge curves relate the discharge of a river to the water level. These curves are essential in hydrology to understand the behavior of rivers and calculate discharge (m3 s-1) at different times. In this study, rating curves were used to assist in predicting a probabilistic model for the recurrence of discharges with magnitude equal to or greater than those of the initial days of flooding in the municipalities (March 18-20, 2023).
The relationship between discharge (Q) and water level (h) in a stage-discharge curve can be represented by an exponential equation in the following form:
where: Q – discharge (m3 s-1); h – stage (m), a and b are rating curve constants, h0 – the stage corresponding to zero discharge (m) (Ramírez et al. 2018).
2.4. Flow Duration Curve (FDC)
The FDC provides a comprehensive graphical representation of the relationship between discharge and frequency (Ma et al. 2023). It was used to indicate the percentage of time when discharges equal to or greater than the reference discharge were observed. Initially, monthly historical discharge data from the stations were collected, and the probability of exceedance was calculated by associating these data with percentiles ranging from 0.05 to 0.95. This range was adopted to emphasize the absence of zero discharge (0%) or absolute discharge (100%) records.
The percentage of time when a specific discharge is equaled or exceeded can be calculated as:
where: f(x) – cumulative frequency for discharge x; n – total number of observations; i – position of discharge x on the y-axis.
2.5. Mann-Kendall test
2.5.1. Missing Data Index (MDI)
Data consistency is a critical aspect of any hydrological analysis (Becker et al. 2023; Peixoto et al. 2023; Pereira 2023; Tsuha 2023). Therefore, before proceeding with this step, the sample quality in the time series of precipitation was rechecked, adopting a threshold of ≤10% of failures (Holender, Santos 2023).
The data provided in HIDROWEB are categorized for quality in each measurement, assigning a number to their category: (0) – blank data (unmeasured), (1) – actual data (measured and verified), (2) – estimated data, (3) – doubtful data (instrumental failures), and (4) – accumulated data (ANA 2002).
The missing data index was calculated as follows:
where: n0 – number of blank data points; n3 – number of questionable data points; nt – sample space.
2.5.2. Sequential test
After qualitative investigation of the data, the non-parametric Mann (1945) and Kendall (1975) tests, as sequenced by Sneyers (1990) and Onoz, Bayazit (2003), were applied in this study to test the significance of a trend present in the pluviometric series.
A time series of a variable yi consisting of n data points, where 1 ≤ i ≤ n, was considered. The procedure involved calculating the sum tn =
Based on this premise, it was found that tn follows a normal distribution, with the mean and variance parameters defined by equations 8 and 9, respectively:
Evaluating the statistical significance of tn with respect to H0 through a two-tailed test, significance is rejected for high values of U(tn), a standardized test statistic, defined as:
Subsequently, using a standardized normal distribution, the calculation of the probability value (a1) is done as follows:
Acceptance of H0 occurs when a1 > a0, with a0 equal to the significance level of the test. If H0 is rejected, it implies the presence of a significant trend in the series: U(tn) < 0 indicates a decreasing trend, while U(tn) > 0 indicates an increasing trend.
In the sequential version, U(tn) is obtained in the forward direction of the series, starting from i = 1 to i = n. This results in the statistic –1.65 < U(tn) < 1.96, where the values of the two-sided intervals –1.65 to 1.65 and –1.96 to 1.96 are associated with significance levels a0 = 0.10 (10%) and a0 = 0.05 (5%), respectively (Mortatti et al. 2004).
The inflection point in the series can be identified following the same approach as with the inverse series U*(tn). The point where U(tn) and U*(tn) intersect provides an approximate estimate of the location of the transition point in the trend. However, this conclusion holds statistical significance only if this change takes place within the two-sided significance interval (Back 2001).
The simplified execution of the steps to obtain the estimated probabilistic model in the present study is shown in Figure 2.
3. Results and discussion
Inaccurate or inconsistent information can lead to erroneous conclusions and negatively impact decisions made based on this data. To ensure the reliability of the data used in this research, consistency checks were performed at the beginning of the analysis and before the Mann-Kendall test.
The first step involved verifying the availability of valid data from the pluviometric stations from 1983 to 2023. The results obtained show that Arame (Fig. 3b) and Santa Luzia (Fig. 3d) had data available for the entire series, Açailândia (Fig. 3a) from 1996 onward; in Buriticupu, the station provides data from 2004 forward (Fig. 3c).
Fig. 3.
Available rainfall data from 1983 to 2023 (a) Açailândia, (b) Arame, (c) Buriticupu and (d) Santa Luzia.
Figure 4 shows the box plots for all stations, plotted for each year from 2004 onward. Recent atypical precipitation events were observed, indicated by the outliers (red points).
In the municipality of Açailândia (Fig. 4a), extreme precipitation events were recorded in March 2008 and 2023 (515.80 mm, 577.40 mm), coinciding with the onset of flooding events (Mar. 18-20 2023). In Arame (Fig. 4b), the outliers correspond to precipitation in February 2007 (264.30 mm); April 2010 (332.30 mm); and March 2019 (376.70 mm). In Buriticupu (Fig. 4c), rainfall anomalies were identified at various times over the years: in February 2007 (411.40 mm); March 2008, 2012, 2022, and 2023 (537.70 mm, 146.70 mm, 475.70 mm, 301.70 mm, respectively); and April 2010 and 2023 (245.30 mm, 358.80 mm). These records confirm the coin-cidence of atypical rainfall with flooding events in the municipality. In Santa Luzia (Fig. 4d), the records indicate critical precipitation in March 2006, 2012, and 2022 (430.70 mm, 363.40 mm, 703.30 mm); and April 2006 (450.20 mm). The results reaffirm that March is typically the rainiest month in the state of Maranhão (Cerqueira, Cerqueira 2023).
3.1. Probabilistic model
Figure 5 shows the stage-discharge curves obtained for each municipality, using streamflow data from the respective station. The exponential equations estimating the relationship between discharge (Q [m3 s-1]) and water level (h [m]) are provided in the caption.
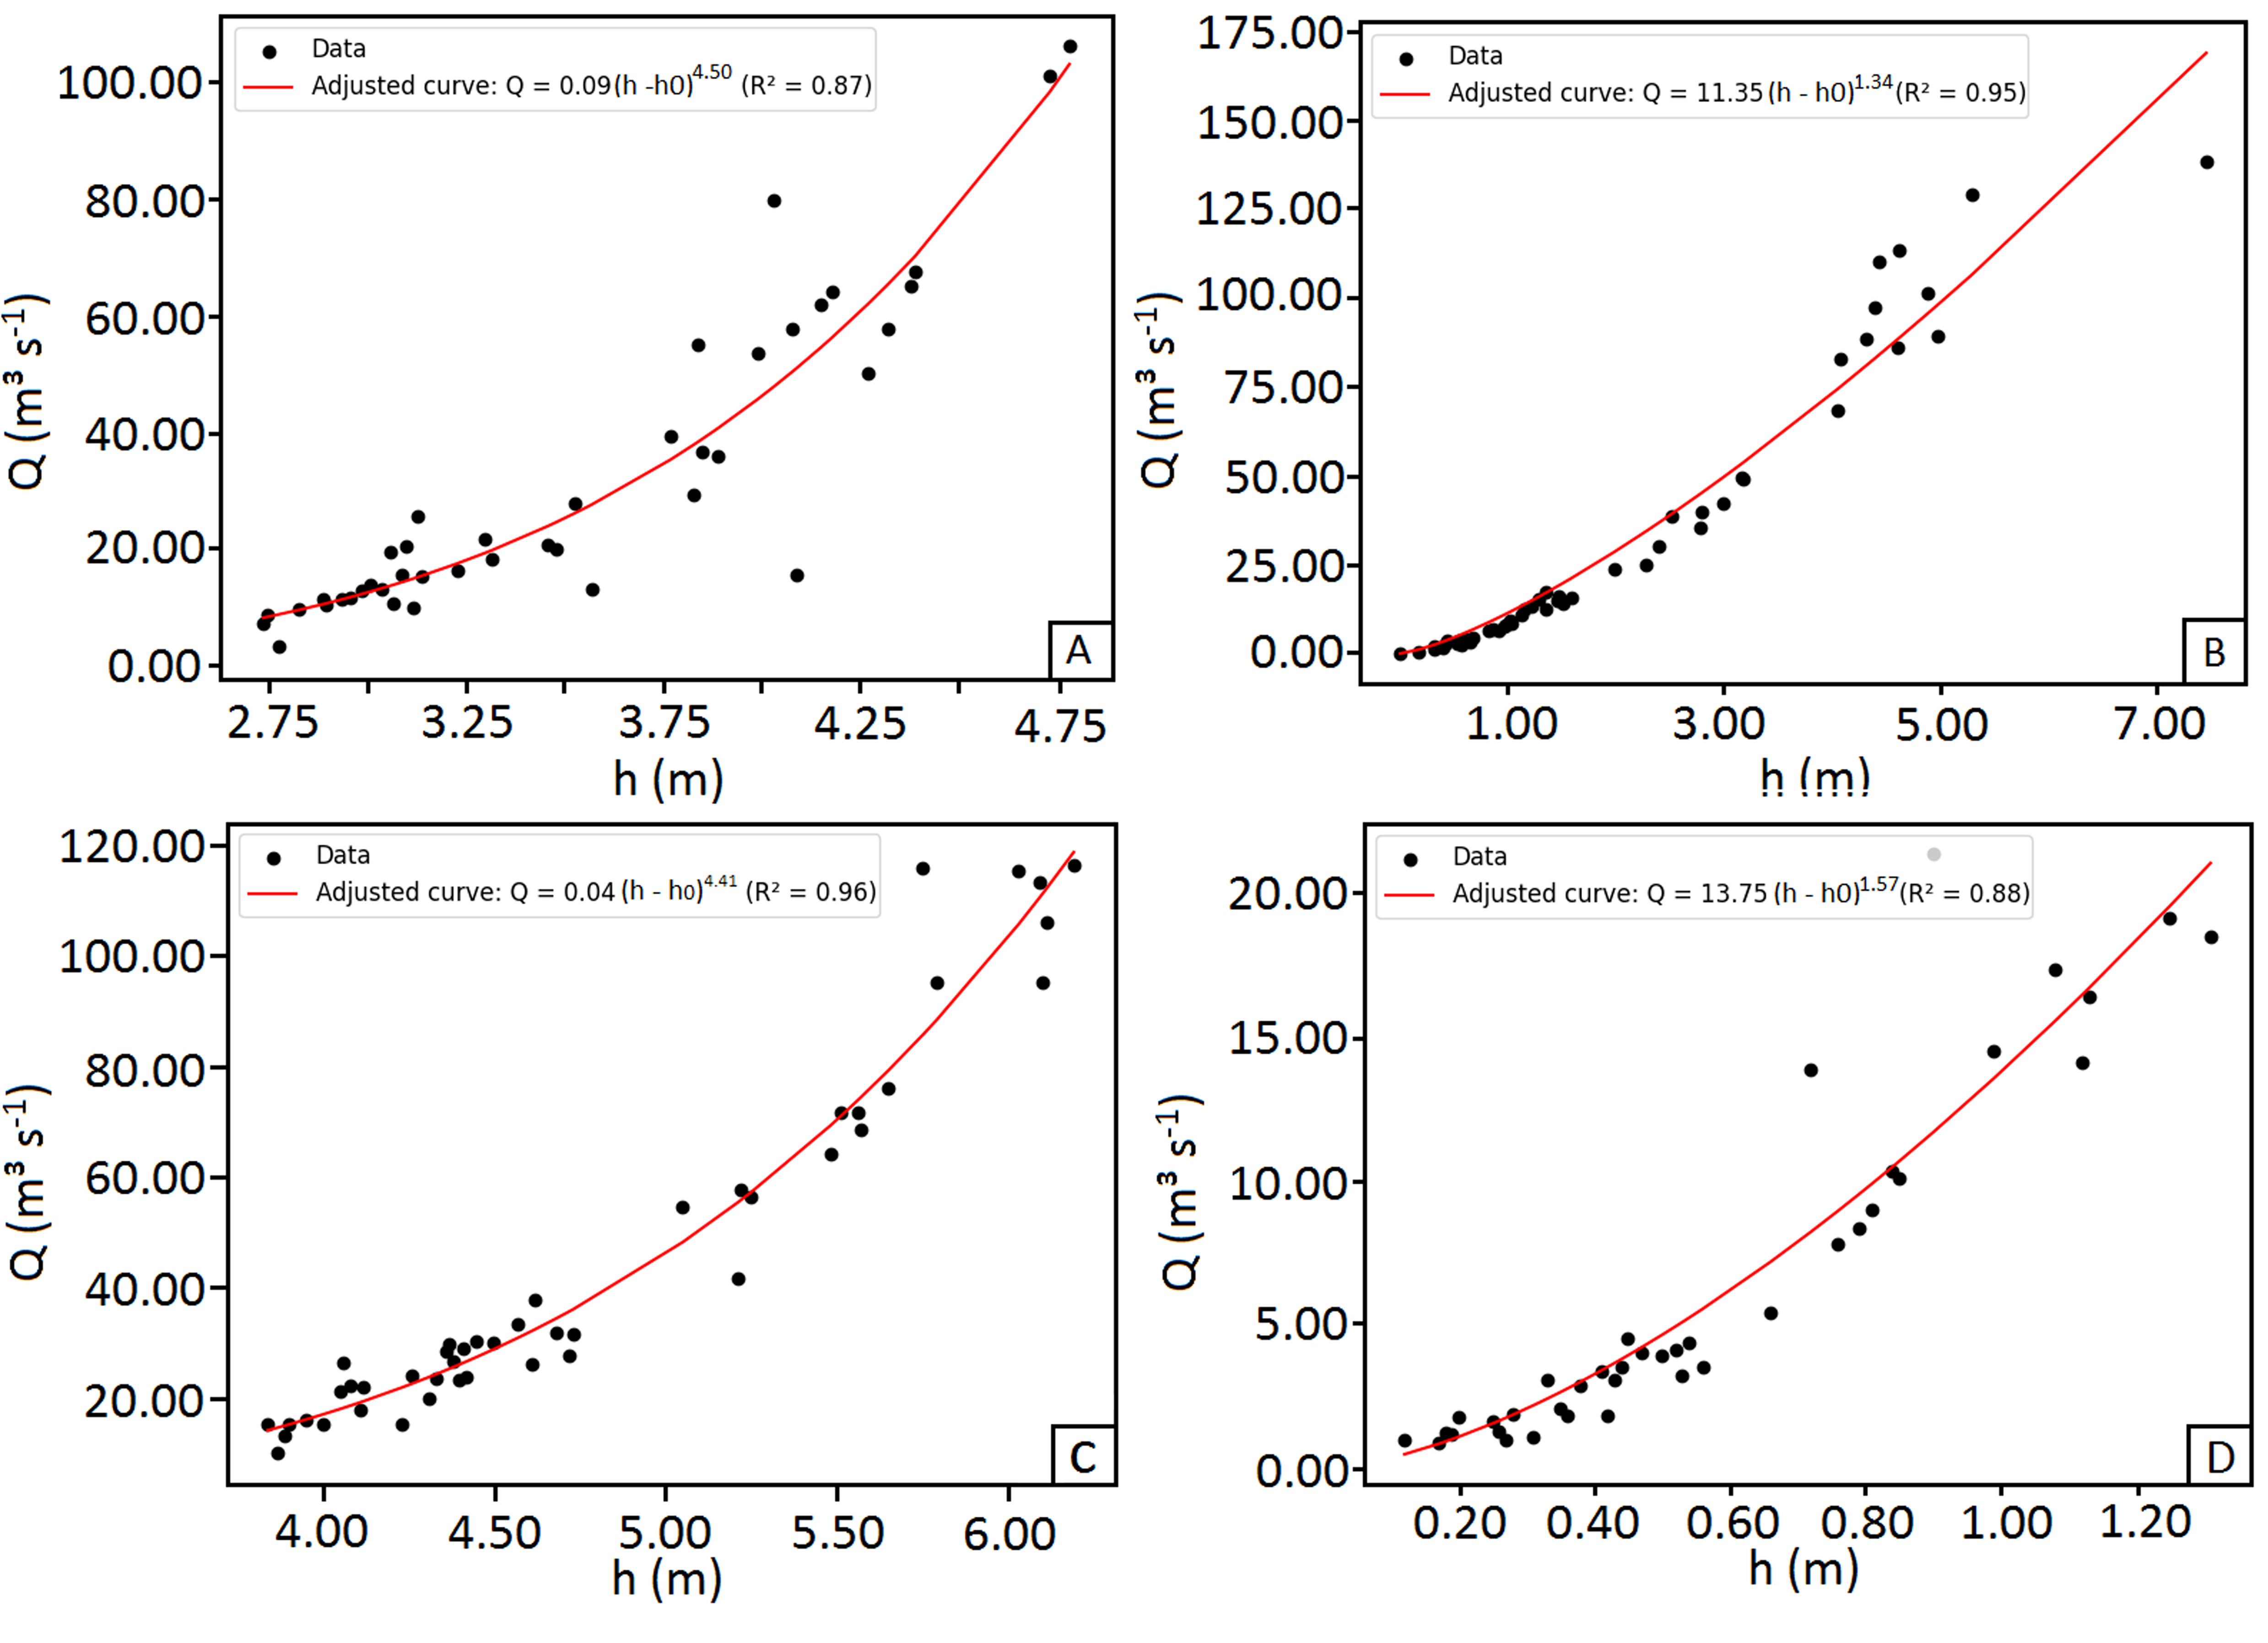
These equations (Fig. 5) were used to estimate the discharge (Q [m3 s-1]) during the first days of flooding in the municipalities (Table 2), at fixed station measurement times (7:00 am and 5:00 pm).
Table 2.
Estimated discharge (Q [m3 s-1]), measured water level (h [m]), and effective zero discharge level (h0 [m]) at the onset of flood events.
Using the estimated discharges on flood days as a parameter, the probability of recurring events of equal or greater magnitude was examined through the monthly FDC of the rivers passing through the municipalities in Maranhão, before (solid lines) and after (dashed lines) the onset of floods, as illustrated in Figure 6.
Fig. 6.
Flow Duration Curves (FDC) of the monthly flow in different periods for the rivers (a) Pindaré Açailândia, (b) Pindaré, (c) Grajaú and (d) Buriticupu.
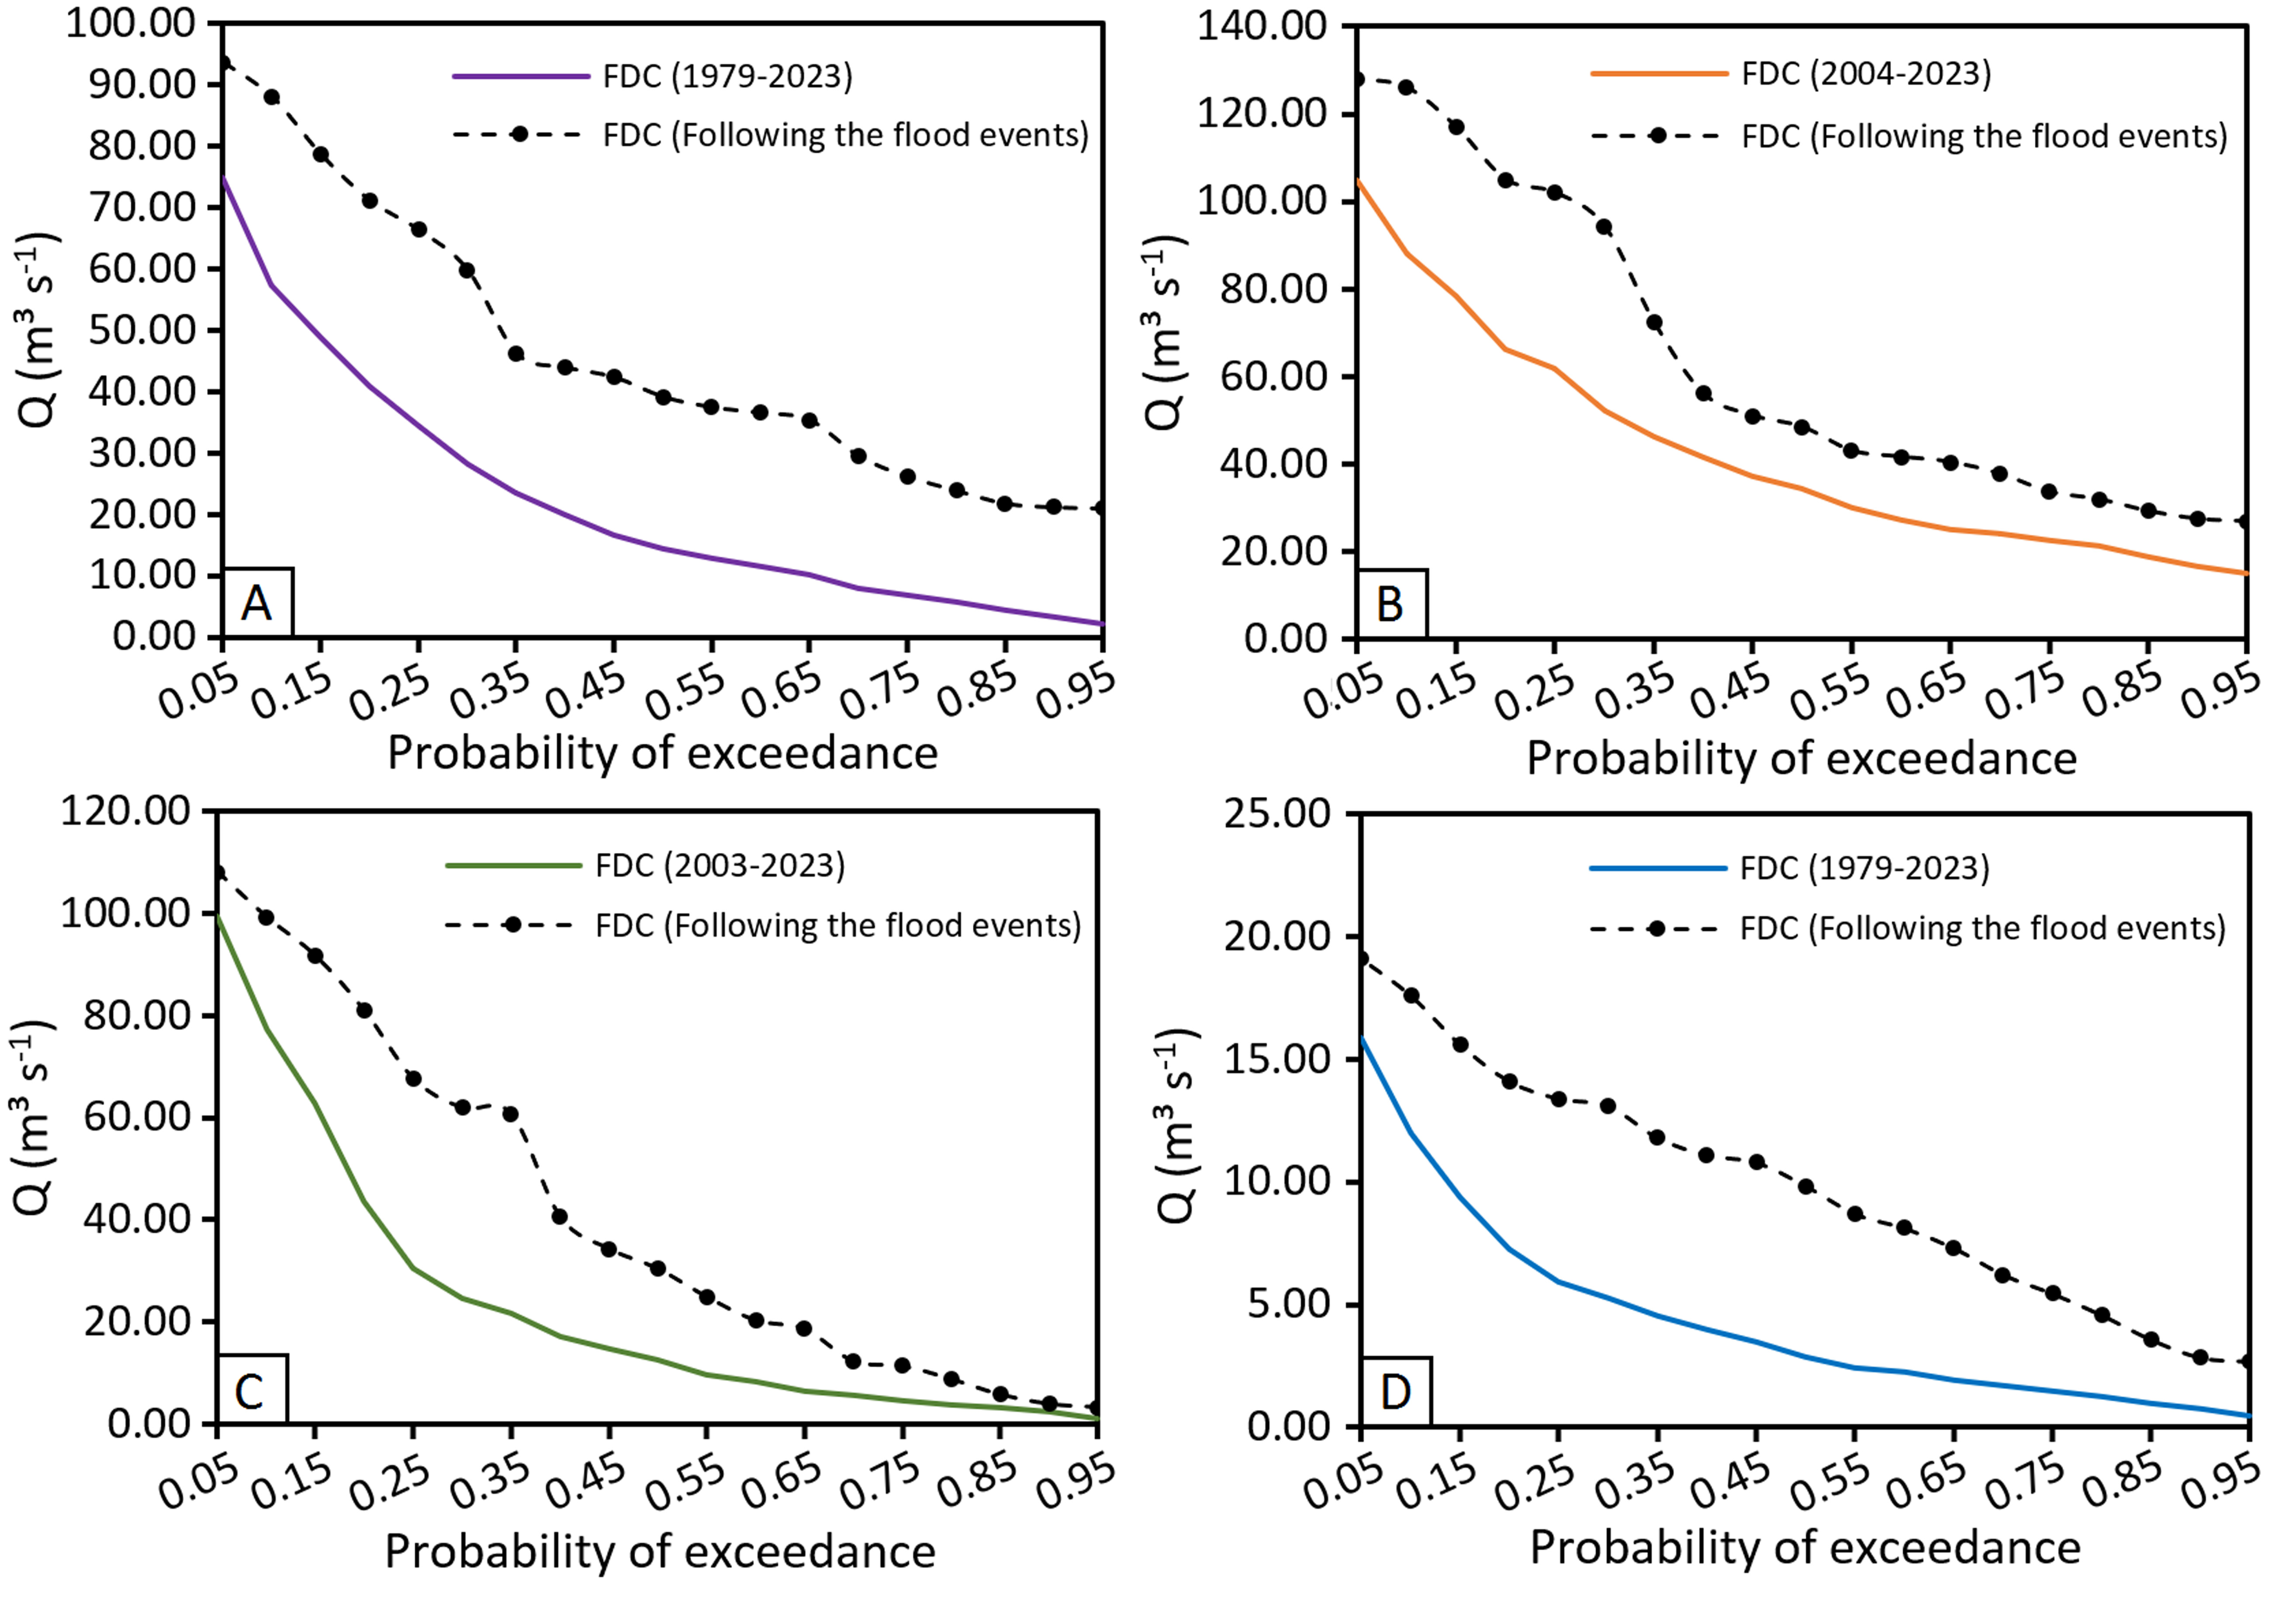
The probability of exceedance in the municipalities can be derived from the data in Table 2 and the FDCs. In the municipality of Açailândia (Fig. 6a), the average probability of exceedance is 10%; about 32% for Buriticupu (Fig. 6b); 15% for Arame (Fig. 6c); and less than 5% for Santa Luzia (Fig. 6d).
3.1.1. Statistical significance
Having established the connection between extreme precipitation events and flooding, data quality was confirmed through the Missing Data Index (MDI) (Table 3), which demonstrated that gaps in the series were within the adopted limit (≤10%). Subsequently, a non-parametric test was applied to the monthly precipitation series.
Table 3.
Summary of pluviometric time series data quality metrics. Time series Data
The results of the Mann-Kendall test are presented in Table 4, focusing on two different significance levels: α0 = 0.10 (10%) and α0 = 0.05 (5%). α1 values equal to or lower than the significance levels confirm a significant trend, depending on the sign of U(tn) for increasing (+) or decreasing (-) trend.
Table 4.
Summary of monthly Mann-Kendall tests on rainfall.
The values highlighted in bold in Table 4 indicate that α1< α0, demonstrating that the null hypothesis of no trend (h0) can be rejected for these months. The municipalities that showed trends in March were Arame (negative) and Buriticupu (positive).
When U(tn) exceeds the confidence interval, the trend can be considered significant, and the points of intersection between U(tn) and U*(tn) represent the onset of this trend in the time series, if it occurs within the confidence intervals (Fig. 7).
Fig. 7.
Monthly rainfall U(t) and U*(t) statistics for (a) Açailândia, (b) Arame, (c) Buriticupu and (d) Santa Luzia.
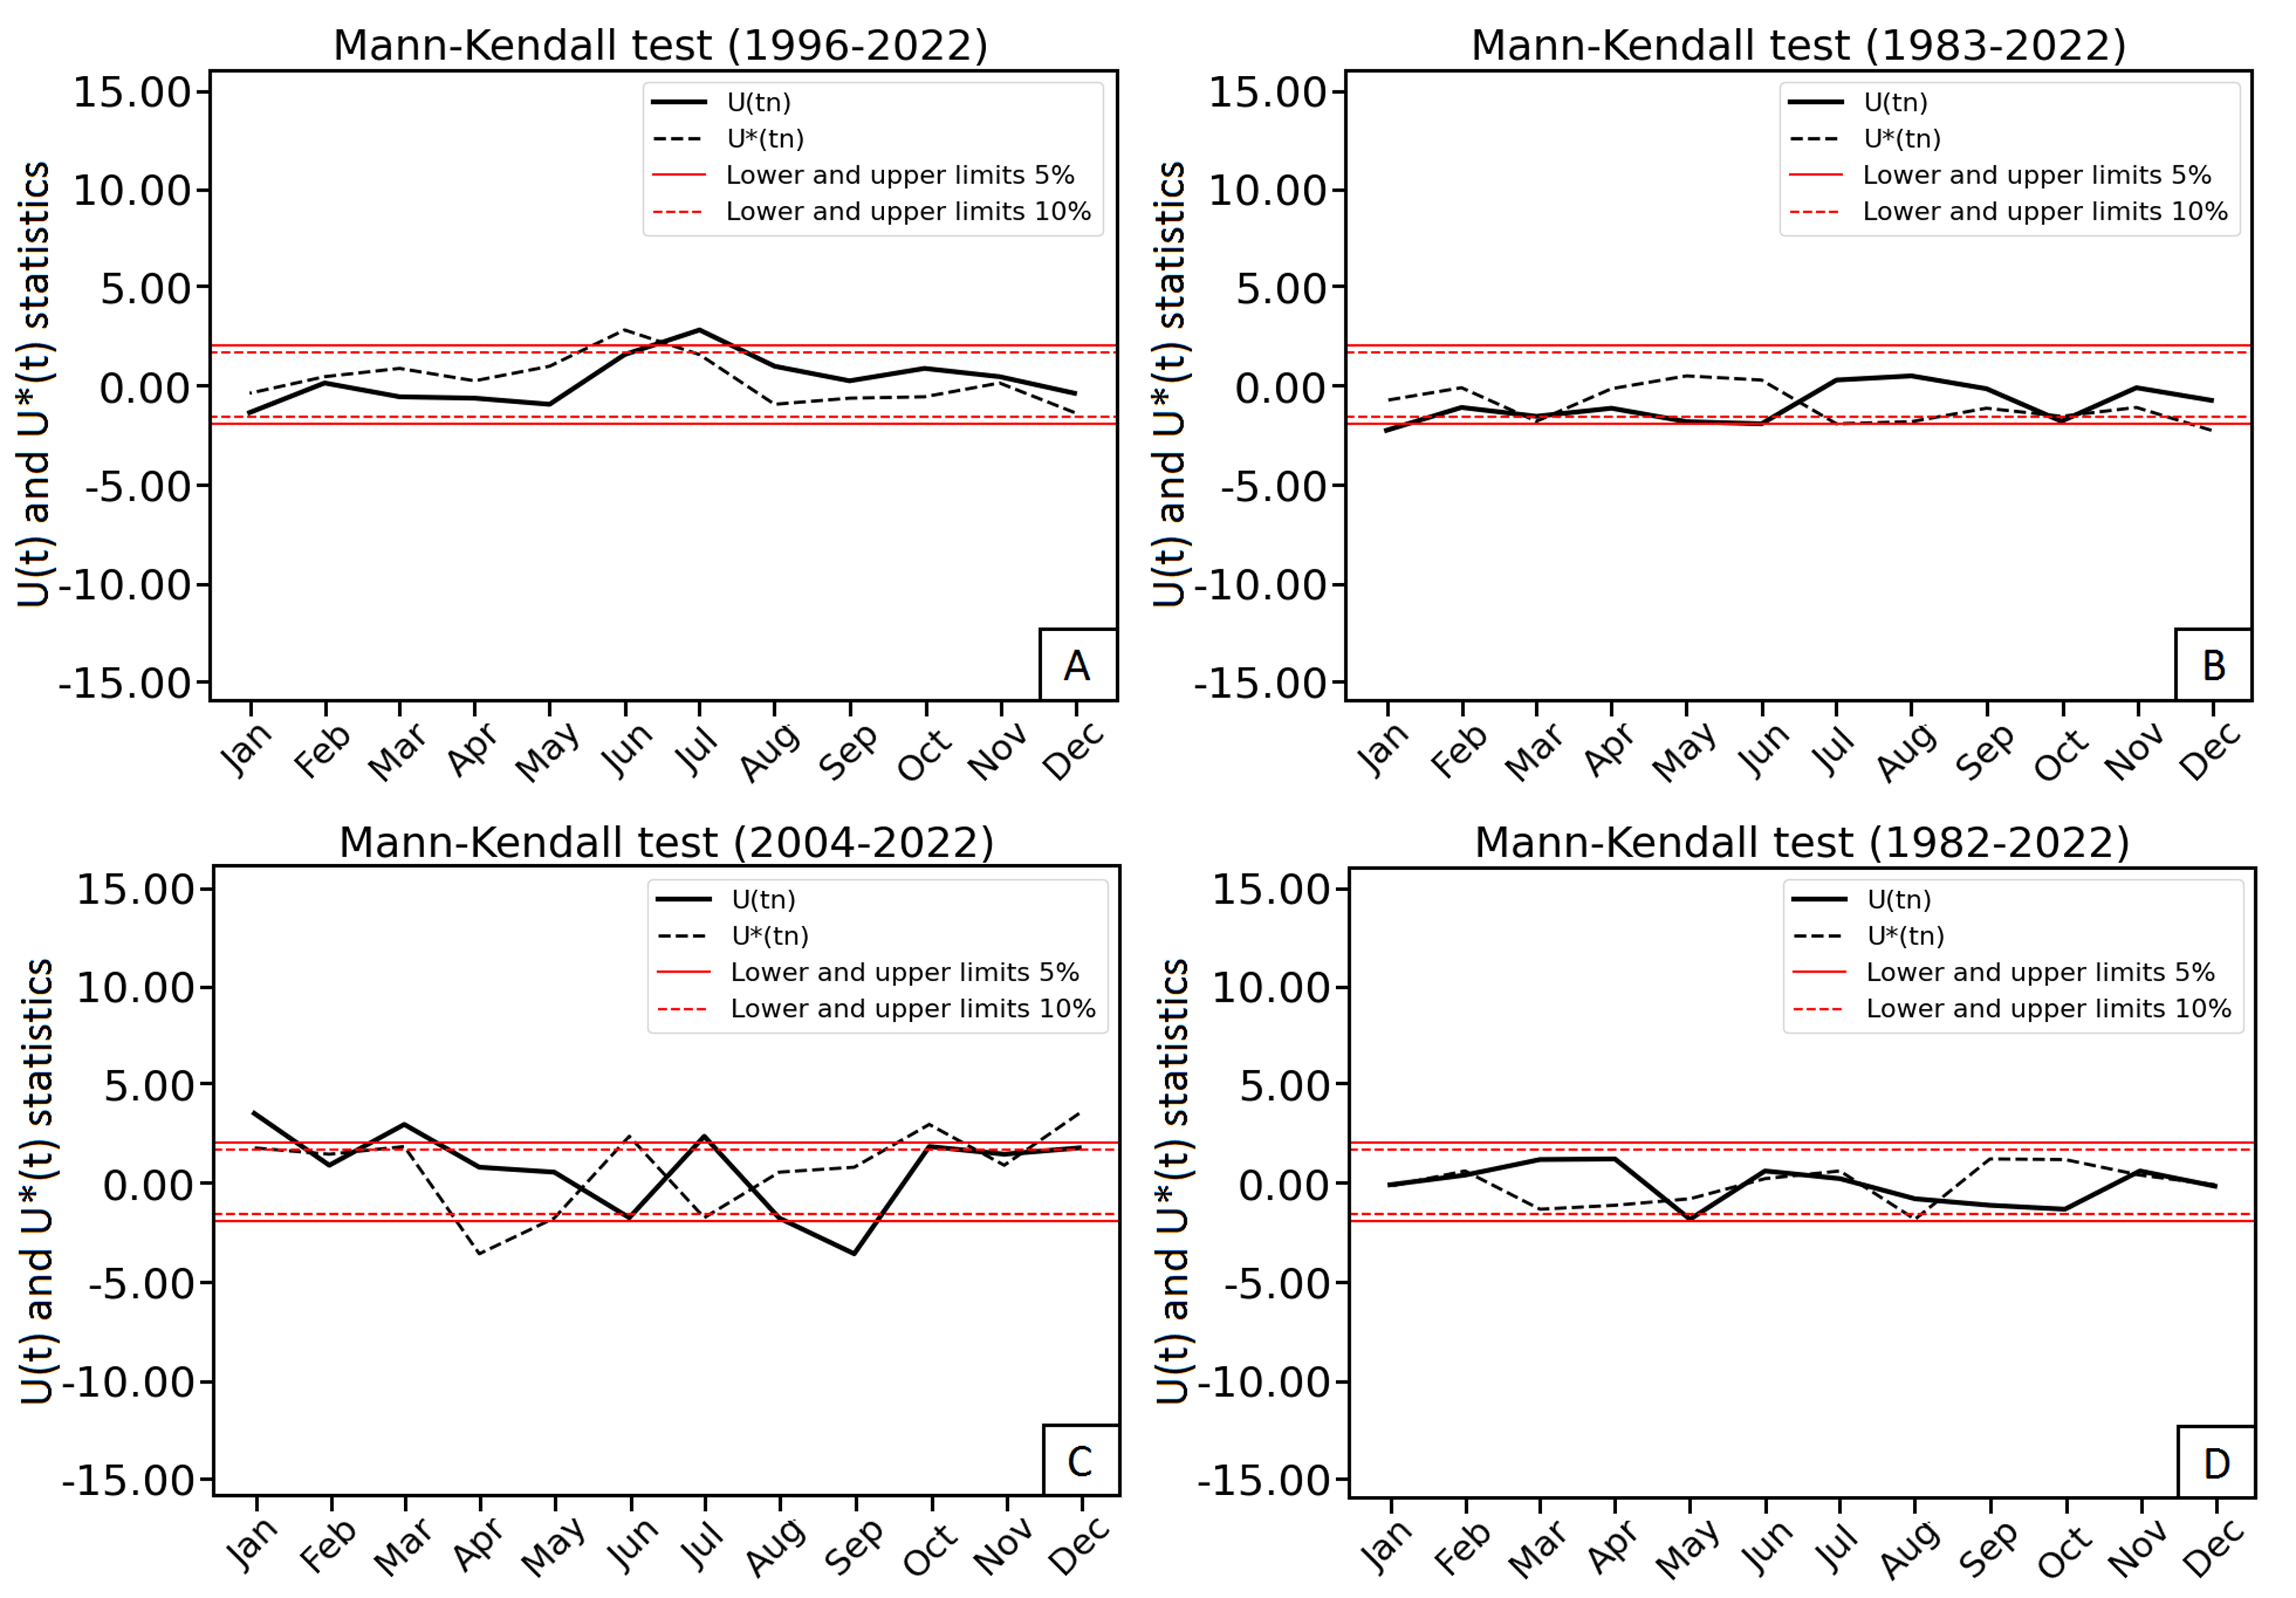
In the municipality of Açailândia (Fig. 7a), there is a possibility of an increasing trend, becoming significant in July. In contrast, Arame (Fig. 7b) indicates decreasing trends that are significant in March, June, and October. Meanwhile, in Buriticupu (Fig. 7c), there are potential positive trends, with a notable emphasis on March and July. In Figure 7d, Santa Luzia exhibited a significant propensity for growth, starting in February and May.
4. Conclusions
The results obtained for the municipalities of Açailândia, Arame, Buriticupu, and Santa Luzia highlighted the direct influence of heavy rainfall on the occurrence of flooding events, particularly during February, March, and April. In Açailândia and Buriticupu, extreme precipitation events were recorded in March 2023, with rainfall volumes of 577.40 mm and 301.70 mm, respectively, coinciding with the floods that occurred in March 2023.
The stage-discharge curves obtained provided equations that describe the discharge behavior as a function of water level in each municipality, providing parameters for flood prevention. This relationship was evident through the Flow Duration Curves (FDC), which indicated the probability of events of equal or greater magnitude at different times before and after the onset of floods.
Furthermore, the Mann-Kendall test revealed significant trends in some monthly precipitation series, emphasizing the presence of ascending or descending patterns in rainfall during specific months. These results underscore the critical importance of monitoring precipitation patterns to ensure water resource management and mitigate the impacts of floods in areas susceptible to extreme events.